| |
|
JUNE 2024 Data Visualization
|
How can we see information? Data visualization transforms data into assets such as graphics or dashboards. Thanks to this practice, end users can have a formatted experience that is scalable, simplified, and easy on the eyes instead of digging through copious amounts of information to find trends. But how does that work exactly? Here’s what you need to know:
|
|
|
Understanding Data Visualization Design Practice With growing interest in the connection between research and practice, there’s still so much to learn regarding data visualization in application! It’s been said that practitioners handle complex situations very differently from researchers and this study aims to close that gap. In this paper, 20 data visualization professionals were interviewed about their design processes, decision-making, and methods.
|
|
|
| |
Data Visualization for Digital Twins Ever wish you had a twin? Try going digital instead. A digital twin (DT) is a virtual representation of a physical object. This article highlights the importance of DTs and how visualization techniques can be used for them in different applications.
|
|
|
|

|
Mesh Shaders and the History of Computer Graphics This video’s lesson will focus on Mesh shaders, which expose the full power of generalized GPU compute capability to the geometry processing pipeline. According to Dr. Jon Peddie, this can unlock a new level of flexibility and performance.
|
|

|
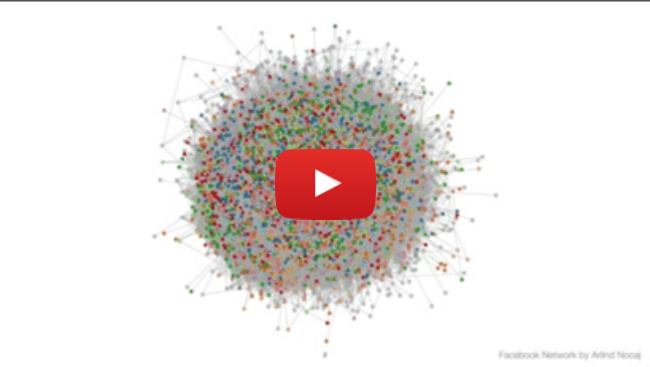
Uncertainty Visualization for Graph Coarsening Sometimes, real-world data calls for complex and costly visualizations, making their analysis a pain to understand. In this video, researchers explore the practice of graph reduction, a method used to reduce the size of a graph while preserving vital properties.
|
|
|
|
|
More Resources
|
Resources for Computer Vision Professionals Thinking of joining the field or learning more about an adjacent career path? Let our resource page be your go-to ‘one-stop shop’ to get started. Get up to speed on the skill sets needed, research provided, and market expectations to begin your journey.
|
SE Radio Podcast
|
Episode 318: Veronika Cheplygina on Image Recognition Vital to computer vision, image recognition enables computers to identify objects, features, or patterns within an image. In this episode, Veronika Cheplygina further expands on this topic, sharing how to obtain satisfactory data sets and what to avoid.
|
| Featured Jobs on our Career Center
|
|
|
|