| A Message from The ProsperityPub Dear Reader,
Every trader wishes they had a crystal ball to see where stock prices are headed.
These “stock hotsheets” might be the shortcut you’ve been looking for 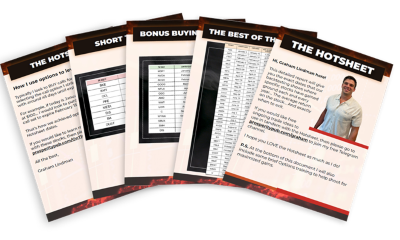
They’ll show you the exact dates you should consider BUYING and SELLING dozens of popular stocks based on our backtesting results.
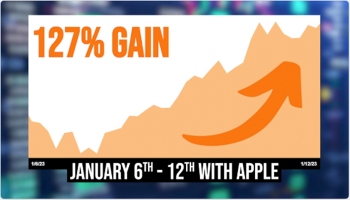
Like with AAPL, the ticker has gone up every January 6th through January 12th… for the last 10 years.
Same thing with LULU… which usually goes up from May 26th to June 11th. 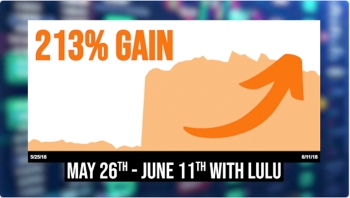
And again with WMT… which tends to go up from July 1st to July 21st every year. 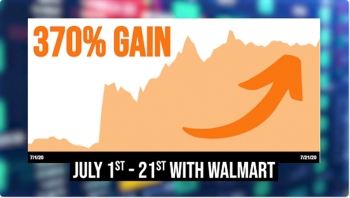
Granted, there would have been smaller wins and those that did not work out but all you need to do is look at the dates…
With these powerful sheets in your hands, designed to help you decide when to place your trades with confidence…
So you can sit back… and relax… without having to spend every day checking charts or indicators.
Needless to say, we won’t always win so I cannot promise future returns or against losses.
But these stock hotsheets are one of the best things I’ve found to help me simplify my trading…
While identifying what could be fantastic opportunities in less time.
Click here to get your hands on these hotsheets today
All the best,
Graham Lindman The profits and performance shown are not typical and you may lose money. We make no future earnings claims. All trades expressed are from historical, backtested data in order to demonstrate the potential of the system. |