GISCafe Weekly Review February 15th, 2018

U.S. Income, Immigration and Impacts Told Through Maps
February 15, 2018  by Susan Smith

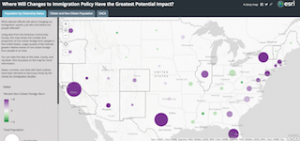
Recently, I began to receive maps pertaining to income, immigration, unemployment and related impacts. It made me consider putting together these maps to show a broader story of what these maps can show us in terms of current as well as historical timelines in terms of income or lack thereof. The following maps also displays communities where the highest number of non-citizen residents and DACA recipients live.


Teledyne Optech
University of Denver GIS Masters Degree Online
Teledyne:


You are registered as: [newsletter@newslettercollector.com].

CafeNews is a service for GIS professionals. GISCafe.com respects your online time and Internet privacy. Edit or Change my newsletter's profile details. Unsubscribe me from this newsletter.

Copyright © 2018, Internet Business Systems, Inc. — 25 North 14th Steet, Suite 710 San Jose, CA 95112 — +1 (408) 882-6554 — All rights reserved.