| A Message from The ProsperityPub Dear Reader,
Every trader wishes they had a crystal ball to see where the markets are headed.
While no one can predict the future, these Stock Hotsheets come impressively close. 
They’ll show you the exact dates—backed by 10 years of historical data—when dozens of popular tickers have typically moved the most.
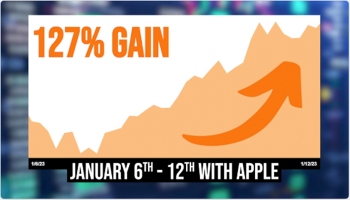
Like with AAPL, the ticker has historically surged January 6th through January 12th… for the last 10 years.
Same thing with LULU… which usually goes up from May 26th to June 11th. 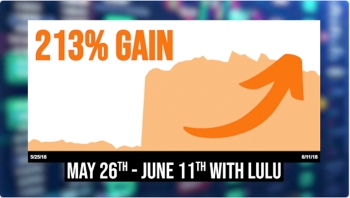
And again with WMT… which tends to go up from July 1st to July 21st every year. 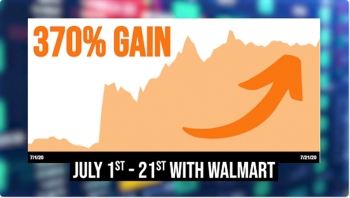
Naturally, there were smaller wins and those that did not work out, but these aren’t random guesses or gut feelings. They’re patterns that have held up for over a decade, and they can give you a serious edge in your trading decisions.
Of course, not every setup plays out perfectly—this is about stacking the odds in your favor with solid, historical insights.
Claim your FREE Stock Hotsheets today—just cover shipping and start trading with more confidence and precision.
Skip the endless chart-checking and guesswork.
Trade smarter, faster, and with data on your side.
All the best,
Graham Lindman The profits and performance shown are not typical and you may lose money. We make no future earnings claims. All trades expressed are from historical, backtested data in order to demonstrate the potential of the system. |