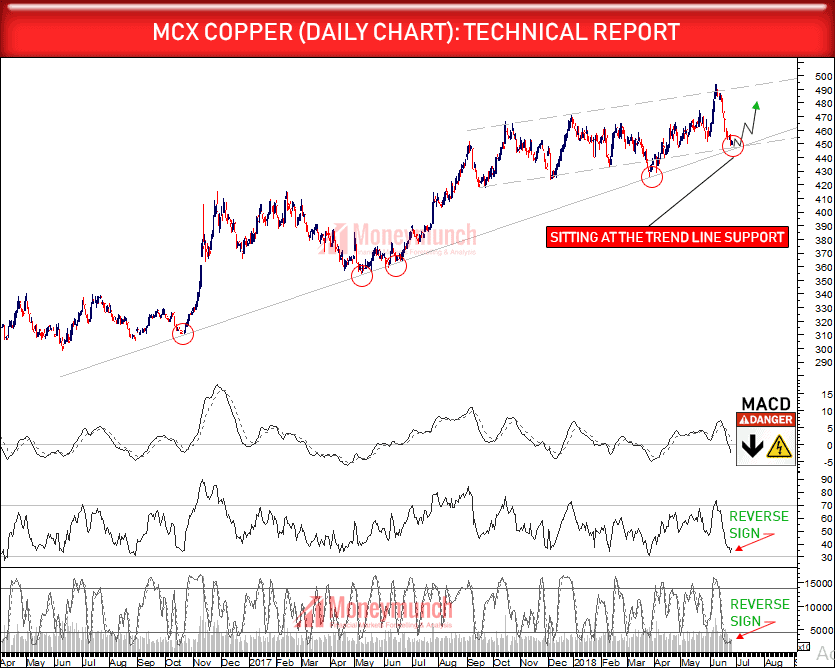
Will copper touch the 2013 year High level (512.6)?
In last 12 trading session copper has lost 38 rupees. As per the above chart, it is sitting at the trend line support of 2017. Is it a gesture that from this support line it will touch 2013’s high of Rs.512.65? Except MACD other indicators & studies are suggesting a strong bullish trend ahead.
Target: 462 – 470 – 486+
Caution: we do not recommend to hold below the support line but initiate a new position repeatedly above support line for the targets.


