MoneyMunch.com

Link to Moneymunch

Lot of time and brainpower attempting for technical analysis for NIFTY

Posted: 02 Oct 2019 03:58 AM PDT

The technical analysis developed through practical experience with the trading markets and has resulted in some sizable fortunes for those following it. Traders and investors hope to buy a security at the beginning of an uptrend at a low price, ride the trend, and sell the security when the trend ends at a high price. Although this strategy sounds very simple, implementing it is exceedingly complex. We’re going to focus on Chart Patterns right now from 2000 to 2005 years of data with the chart.

The first and most important, of course, is to determine when a trend is beginning or ending. The money is made by “jumping” on the trend as early as possible. Theoretically, this sounds simple, but profiting consistently is not so easy. Let see the look on the following chart which can help you to understand the technical analysis and patterns.

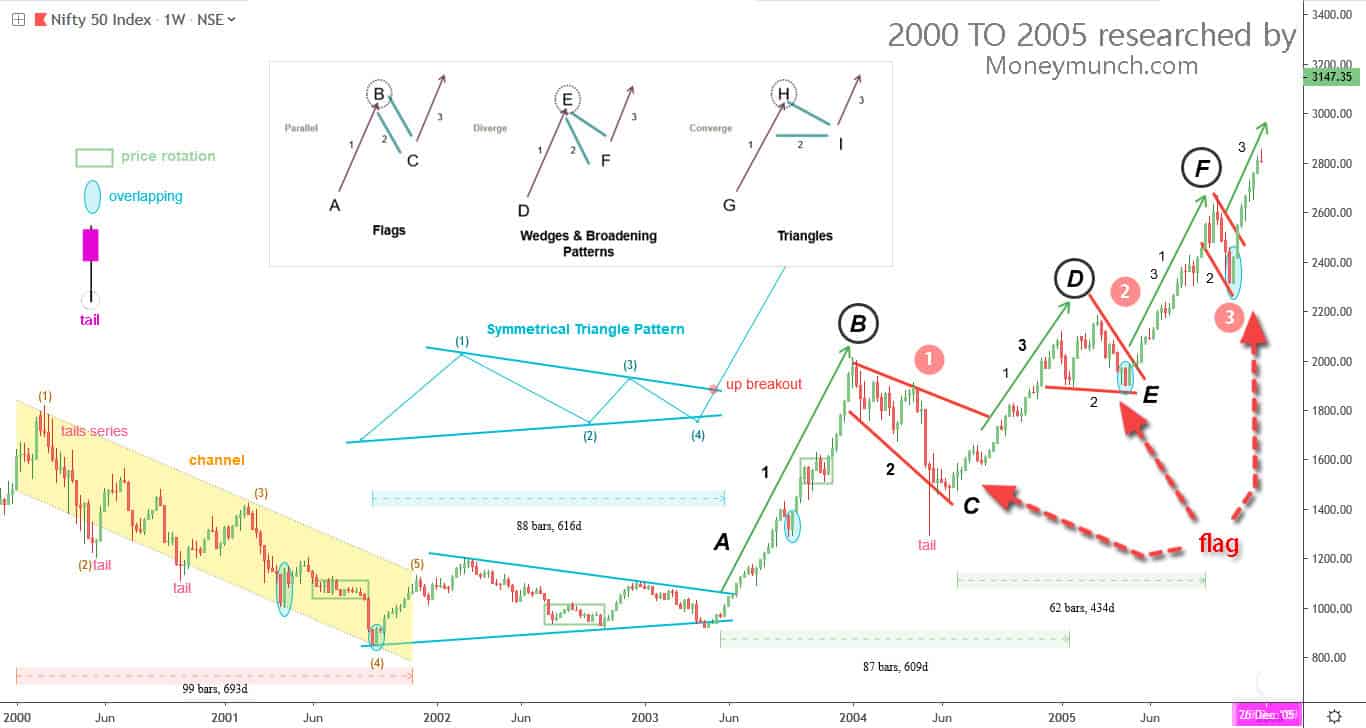
What exactly is this trend that the investor wants to ride to make money? Recognizable patterns form within a trend will always give you a great opportunity to make money.

The “Channel Pattern” started in Jan. 2000 and ended on Nov. 2001 and the color of that pattern is indicated by orange.

The “Triangle Pattern” a period of consolidation by wave(1),(2),(3) and (4) which was started on Nov. 2001 and Break-Out(wave no. 5)has been represented in Jun. 2003 which is drawn by blue color.

Simple 3 flag patterns detected,

  • 1 flag pattern
  • 2 wedges and broadening flag pattern
  • 3 triangle flag pattern

After exploring all data from 2000 to current year data, You can easily understand the repetition of patterns and identify them.

The post Lot of time and brainpower attempting for technical analysis for NIFTY appeared first on Moneymunch.