MoneyMunch.com |  |
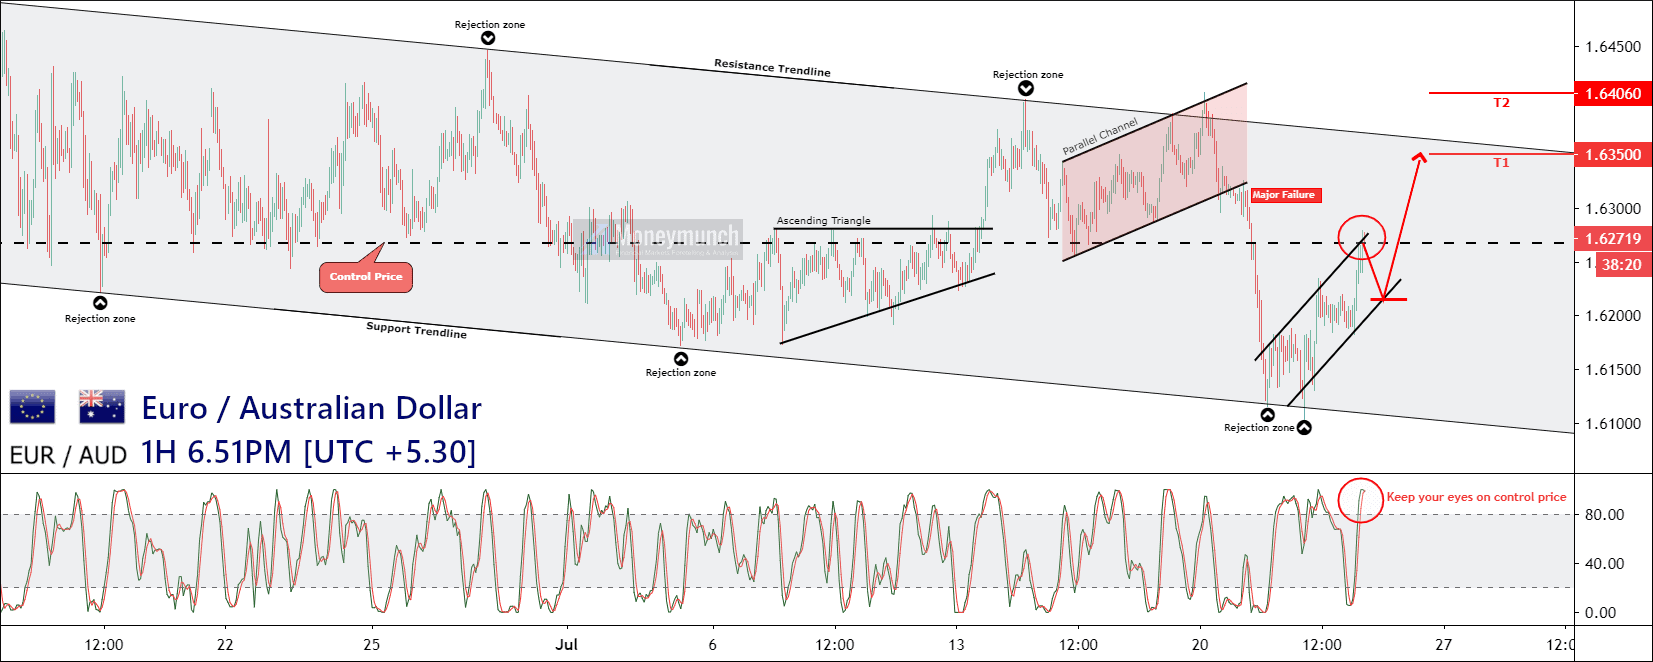
| The Big Move In EURAUD May Be Right Now Posted: 23 Jul 2020 06:47 AM PDT EURAUD price begins to accelerate higher faster than other currencies from the control price (CP). It can hit 1.63500 – 1.64060 after crossing the CP level. Hurdle: 1.62150 This hurdle is a game-changer. It could explode downward and prices may fall 1.61850 to 1.61360 levels. The above information is sufficient for a smart trader to start minting money. Would you like to get our all forex (fx) updates instantly? We have an option for you. Do you want to get Premium Calls only? If you have any questions or concerns about Forex Market then contact by following ways: Have you any question/feedback about this article? Please leave your queries in the comment box for answers. The post The Big Move In EURAUD May Be Right Now appeared first on Moneymunch. |
| How to trade using RSI Indicator a tool? Posted: 23 Jul 2020 12:50 AM PDT RSI-relative strength index “Inventor-j.welles wilder,jr, invented in 1978” What is Relative Strength Index (RSI)?  Relative Strength Index (RSI) is a momentum oscillator, Measuring the velocity and magnitude of direction of price movements. Momentum is the rate of the rise or fall price in RSI. It is used in computer momentum. The relative strength index was developed by j. Wellles Wilder and published in a 1978 book. How to calculate RSI? 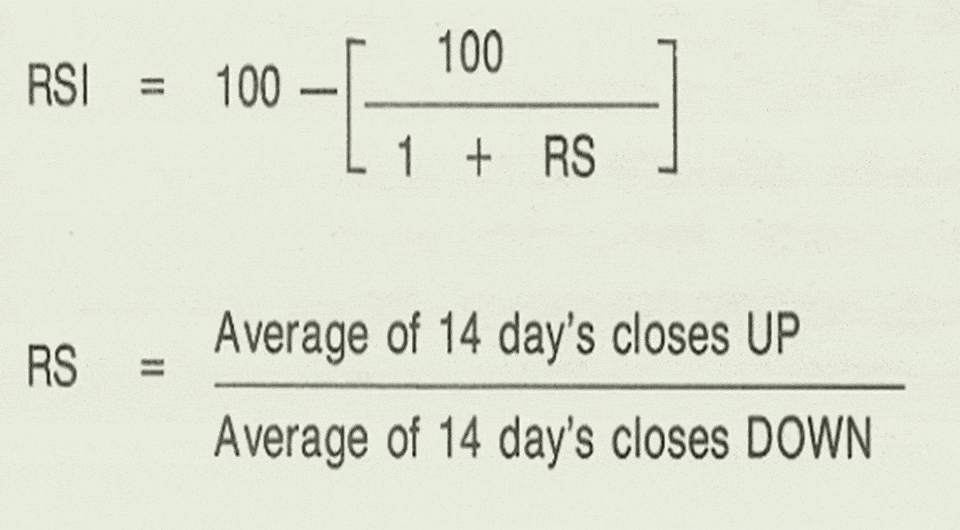 The smoothed moving averages should be appropriately initialized with a simple moving average. How does RSI help in trading? 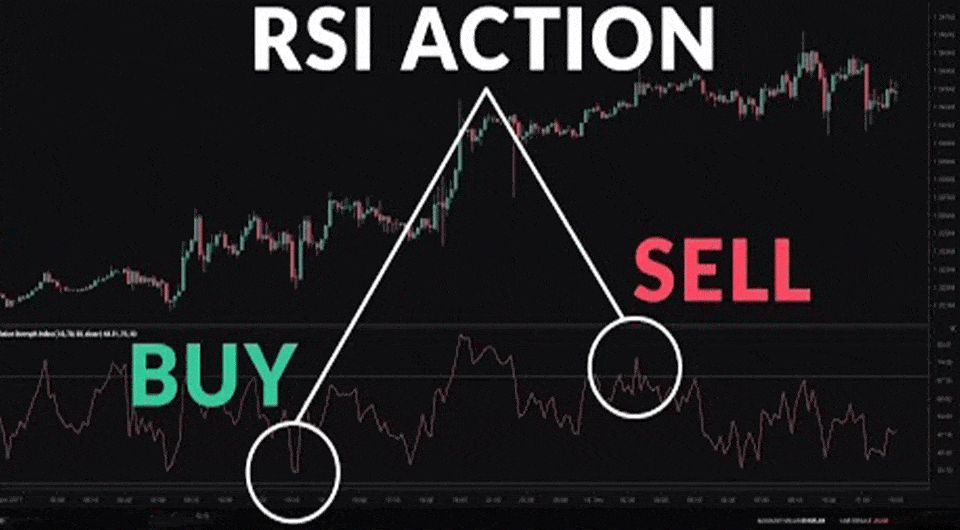 The price oscillates between 0 and 100, traditionally the RSI is considered overbought when above 70 and over sold when below 30. When indicators start going above 70, then it’s called the market overbought and it signals for the sell. When indicators start going below 30 , then it’s called the market oversold and it’s a signal for buy. Uptrend and downtrends: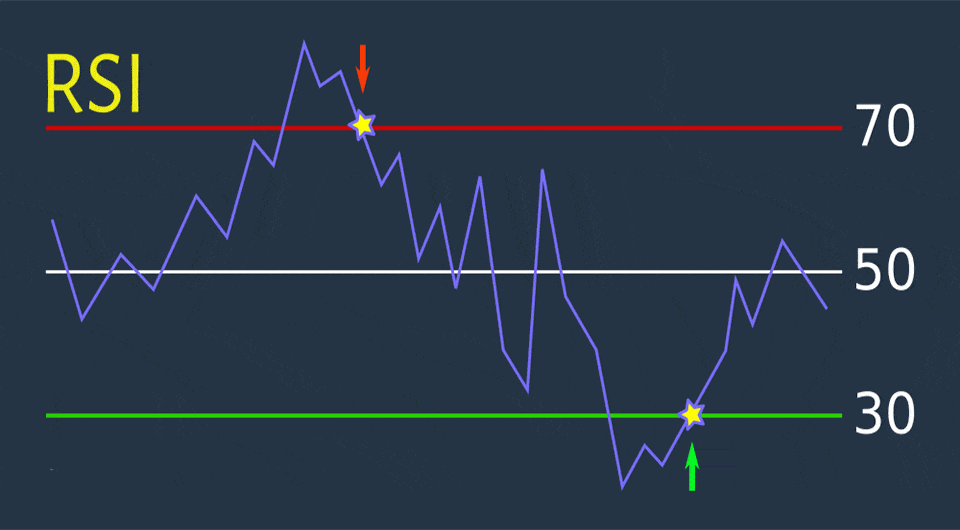 (1)RSI Bullish-indicators survive in the range of 50-100. (2)RSI bearish-indicators survive in the range of 0-50. (3)RSI sideways-when indicators survive around 50,minor momentum Indicators pattern-double top and bottom double: 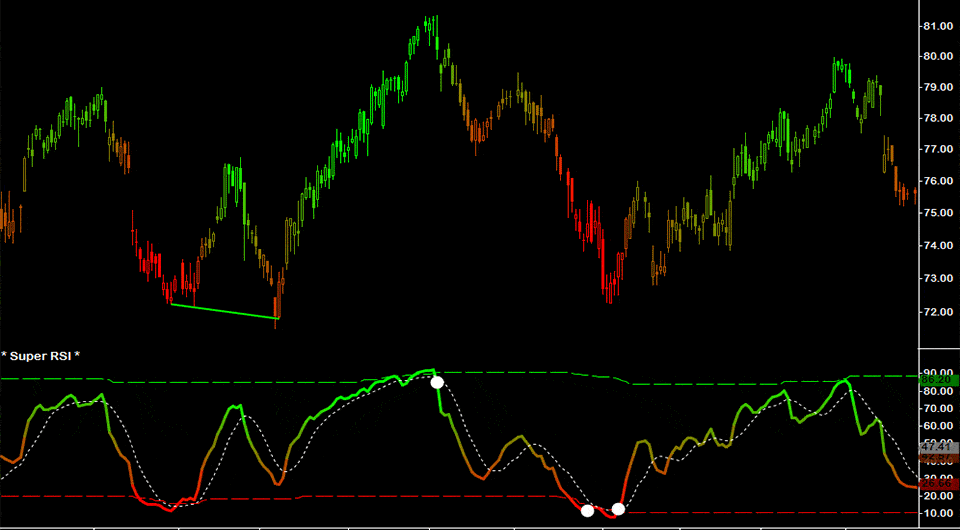
Whenever an indicator creates a double top in the range of 70-100,then is the signal of strong reversal. Whenever an indicator creates a double bottom in the range of 0-30,then is the signal of a strong reversal. The post How to trade using RSI Indicator a tool? appeared first on Moneymunch. |
| You are subscribed to email updates from Moneymunch. To stop receiving these emails, you may unsubscribe now. | Email delivery powered by Google |
| Google, 1600 Amphitheatre Parkway, Mountain View, CA 94043, United States | |
