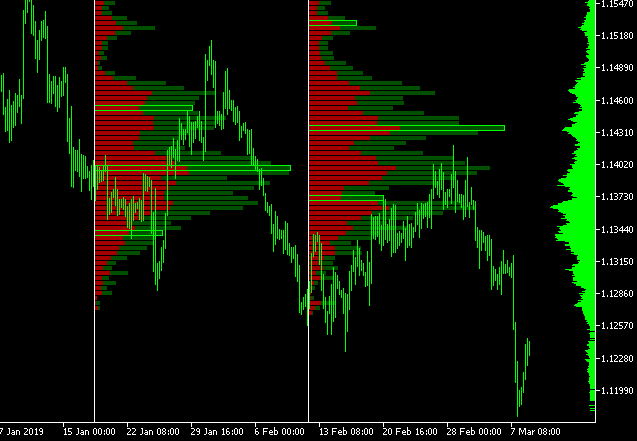
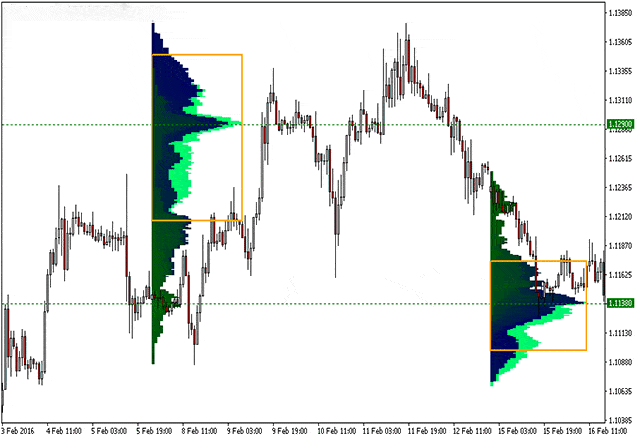
How are these volume profile bars created?
It takes total volume traded at a price, in a specific time period, and divides total buys and sell volumes and shows it on a histogram chart.
Traders can understand and use these volume profile indicators as the most powerful tools in their trading.
Different types of volume profile:There are three different types of volume profile. These types are not so much different in what they do. Their difference is how they show on your chart and the exact time period you want to see
Visible range(vpvr) volume profile visible tool that everyone uses it comes next to price level as a histogram Vpvr automatically shows the volume traded in the price level from the candles shown on the screen. If you charge or go back and forth in your price actions time period, the volume profile visible range will change
Fixed range volume profile fixed range is the exact same volume profile with a minor difference.
When you want to see the traded volume in a time period of price action such as an up trend or downtrend you can define the start and end point and see the volume profile only for that time period.
The benefits of using vpfr is that the volume volume profile Will not change by scrolling in the chart and it always shows the traded volume in the price levels only for a selected amount vof candle.
Session volume (vpsv) Volume profile session volume shows the volume volume profile for all sessions shown on a chart .
You see divided volume profile for each session presenting on the chart. Each session is considered a day and it is the same with the change time period of the charts.


