Determining the MCX Gold Price Next Big Move
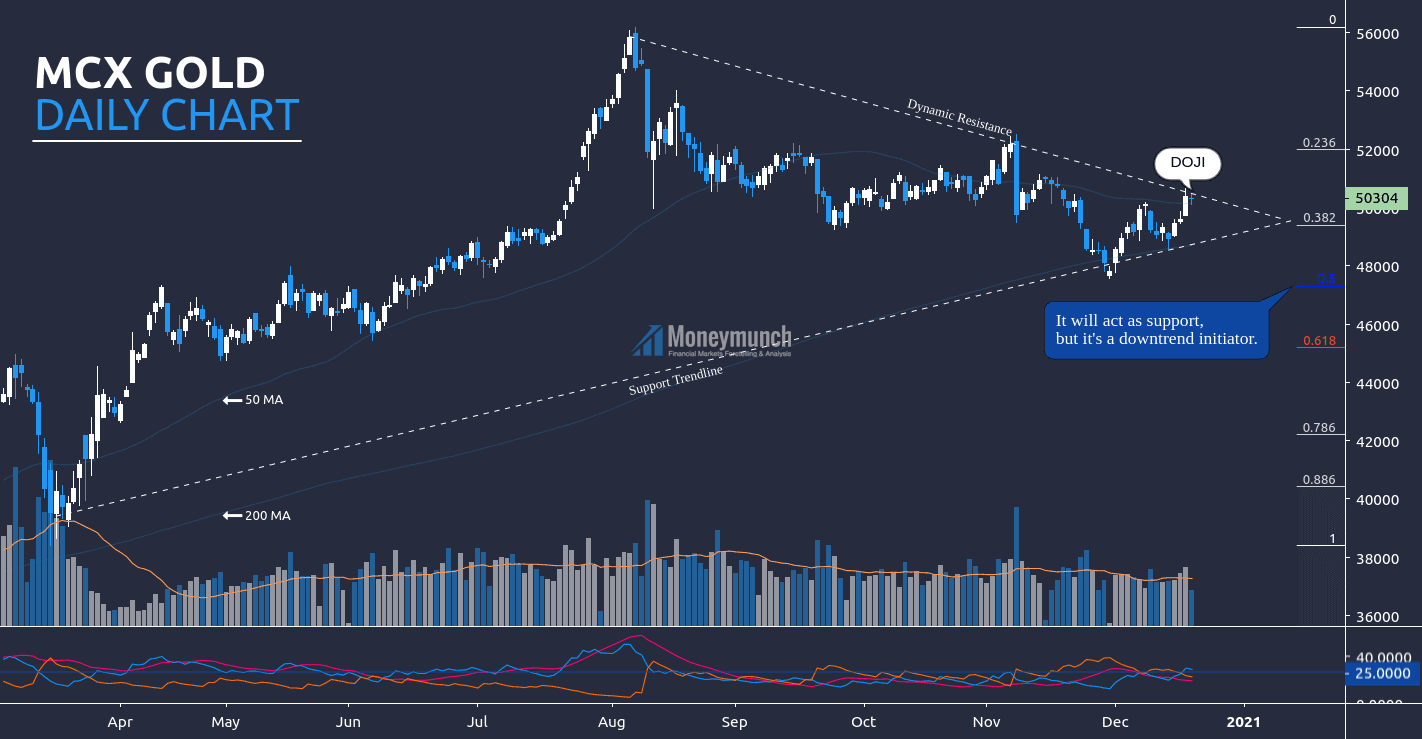
According to this chart, gold has started falling from August month. Doji appearing in the last trading session. It’s signaling a possible reversal. If gold follows the dynamic resistance, we may see a continuous downtrend. That can be up to 0.5 (47300) to 0.618 (45200) of Fib retracement.
Fib retracement (reverse):
Swing High: 56191
Swing Low: 38400
Here’s ADX less than 25, and +DI is above the -DI . Additionally, 200 MA & 50 MA is throwing uptrend signals. If we follow the moving average, gold may try to hit 51000 – 51990 (0.236) levels.
Intraday traders should watch dynamic resistance before entering.

Silver Follow Up & Future Predictions For 2020 & 2021 – Part I
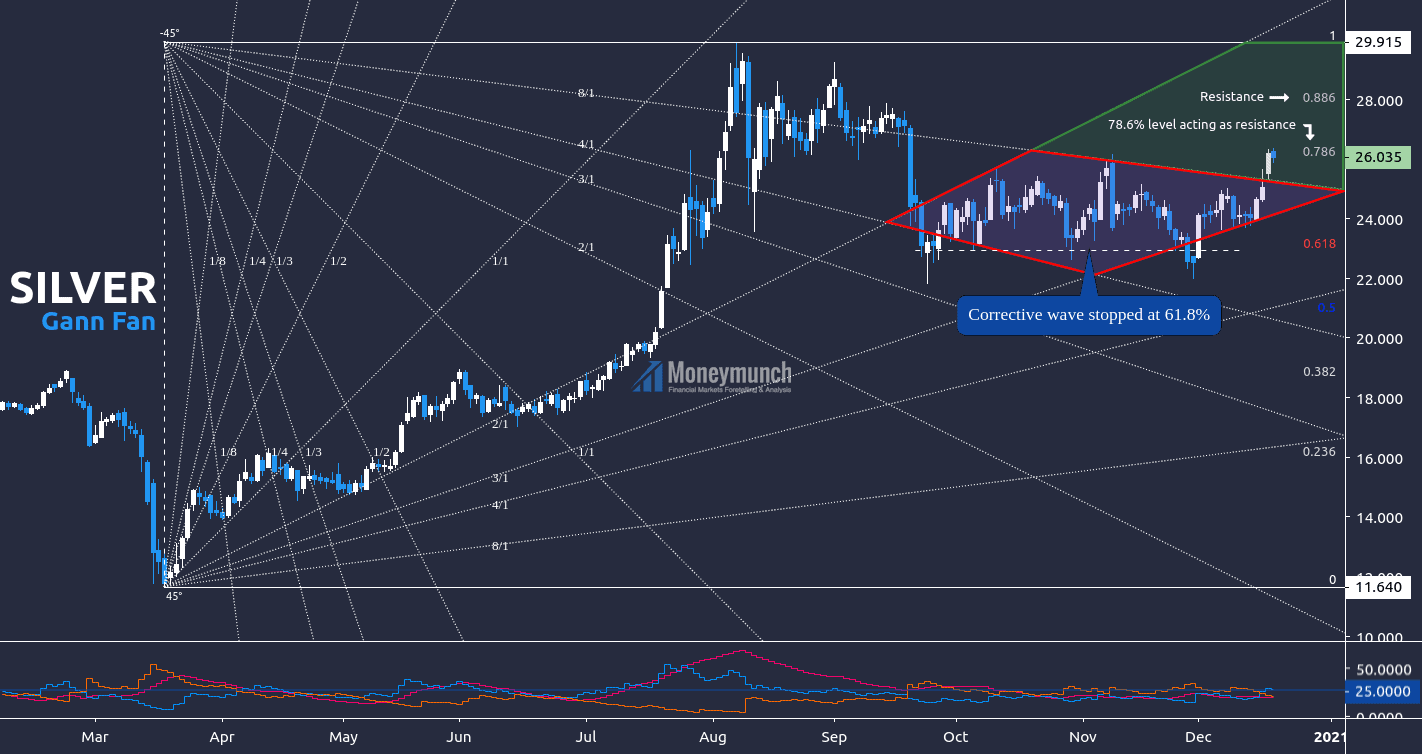
Here I have used Gann fan and Fibonacci on Silver sport to identify the current trend.
Fib Retracement:
Top: $29.90
Bottom: $11.64
If silver remains above the 78.6% level, the target will be $27 – $27.8
And if it goes inside 8/1 or remains below 78.6% level, we will see the silver price at 0.618 value of fib retracement. The day traders can use the following levels as targets: $25 – $24 – $23
According to DMI, ADX is less than 25 but turning up. And +DI is signaling an upside rally. Technically, silver is a further advance.
For advance traders, watch significant releases or events that may affect the movement of gold , silver & crude oil:
Monday, Dec 21, 2020:
Wednesday, Dec 23, 2020:
- 3:00 – API Weekly Crude Oil Stock
- 21:00 – Crude Oil Inventories, EIA Refinery Crude Runs (WoW), Crude Oil Imports, and Cushing Crude Oil Inventories
- 21:30 – Natural Gas Storage


