MoneyMunch.com |  |
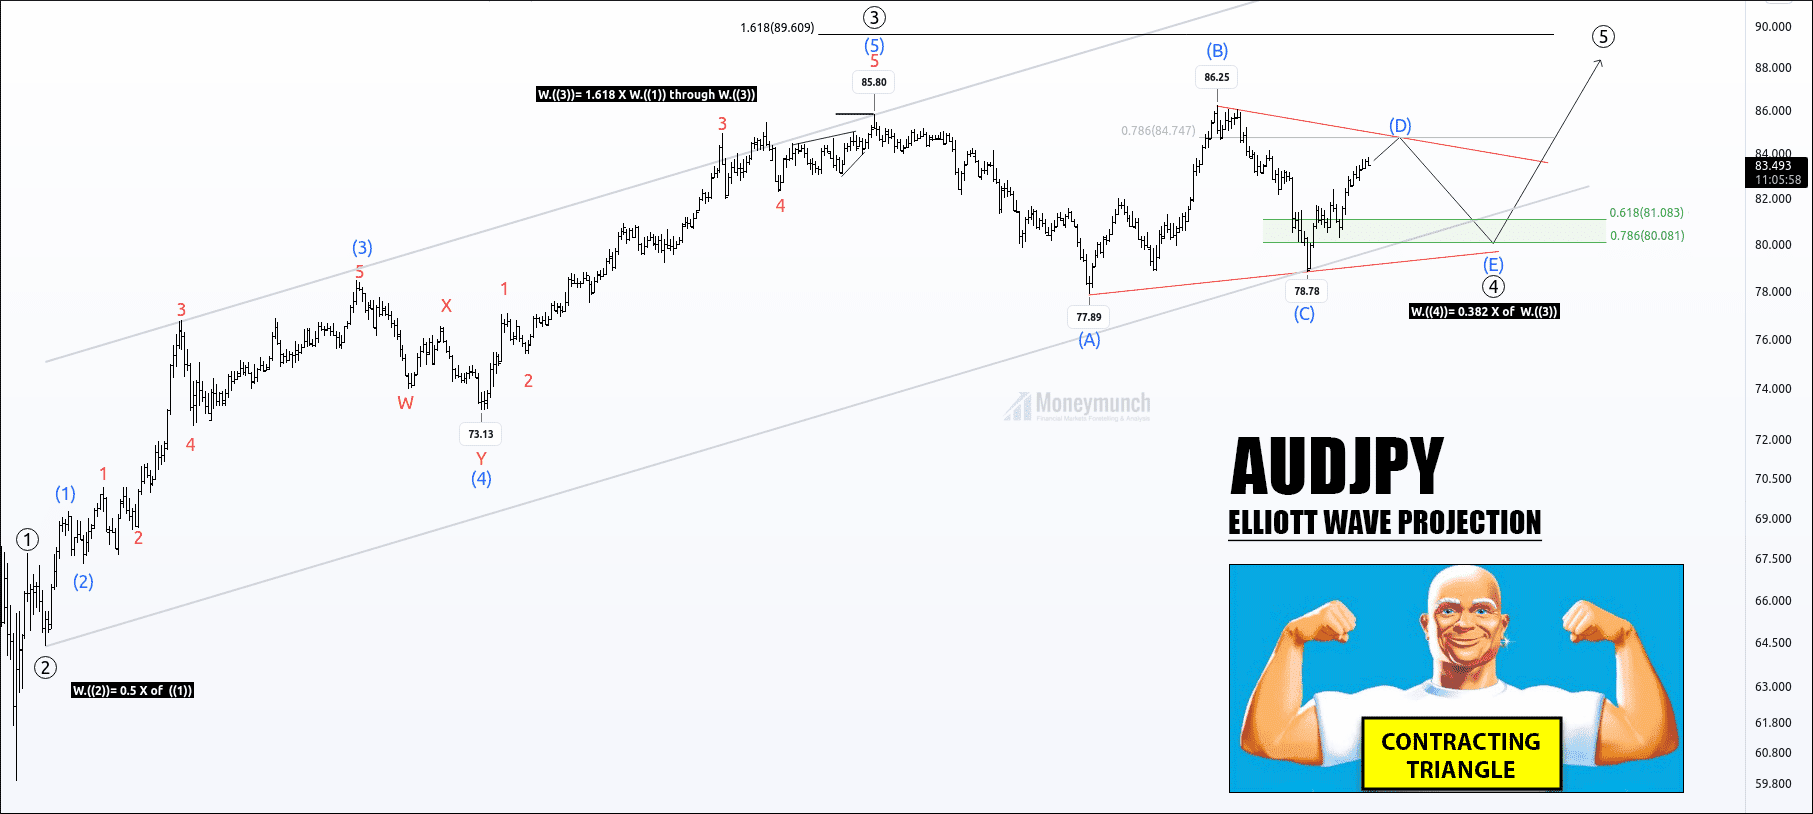
| AUDJPY Is Forming A Contracting Triangle Posted: 03 Jan 2022 03:57 AM PST Currently, AUDJPY is forming a contracting triangle on the corrective wave ((4)). Price has completed sub-wave (C), and sub-wave (D) is in progress. After completion of the (D) wave, the terminating wave sub-wave (E) will break the B–D trendline of the contracting triangle. Wave (D) can end nearby 78.6% retracement of wave (B). Wave (E) can complete between 0.618 to .786 Fibonacci levels. Would you like to get our all forex (fx) updates instantly? We have an option for you. Do you want to get Premium Calls only? If you have any questions or concerns about Forex Market then contact by following ways: Have you any question/feedback about this article? Please leave your queries in the comment box for answers. The post AUDJPY Is Forming A Contracting Triangle appeared first on Moneymunch. |
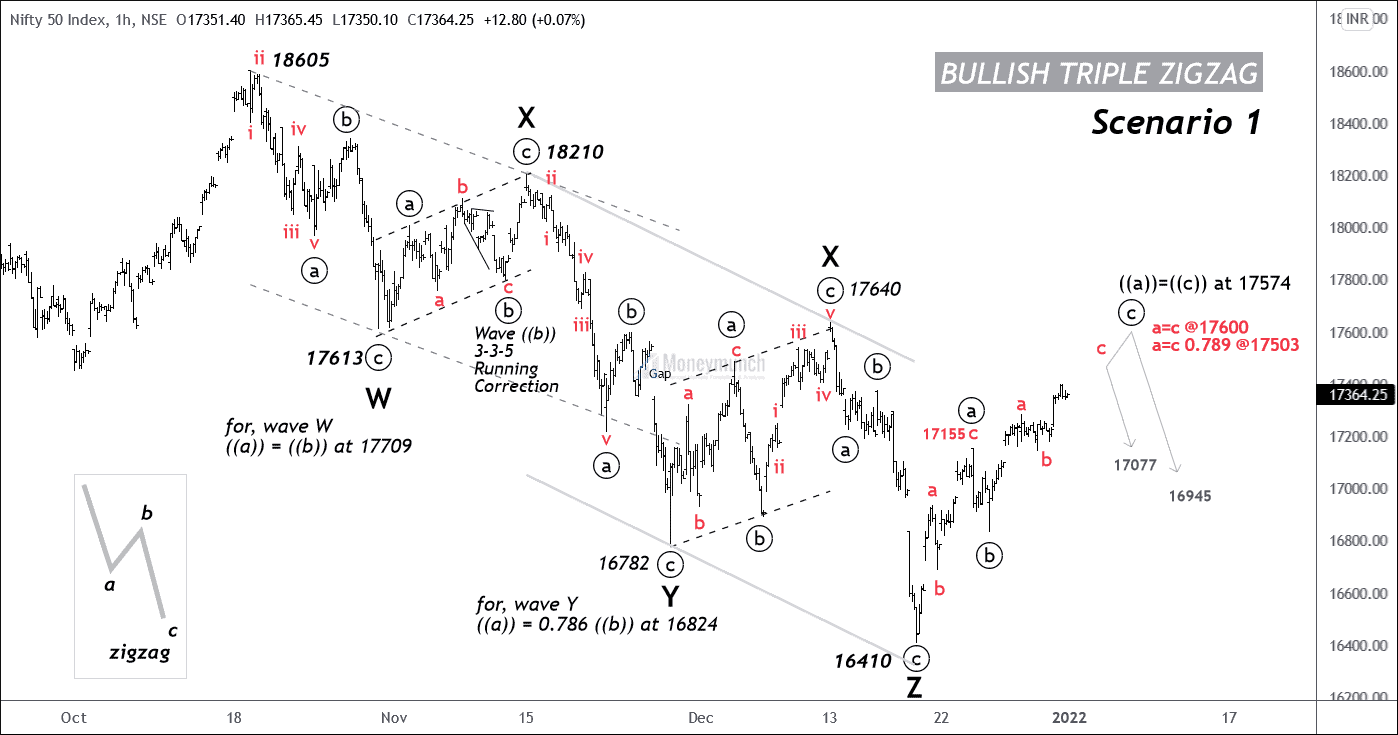
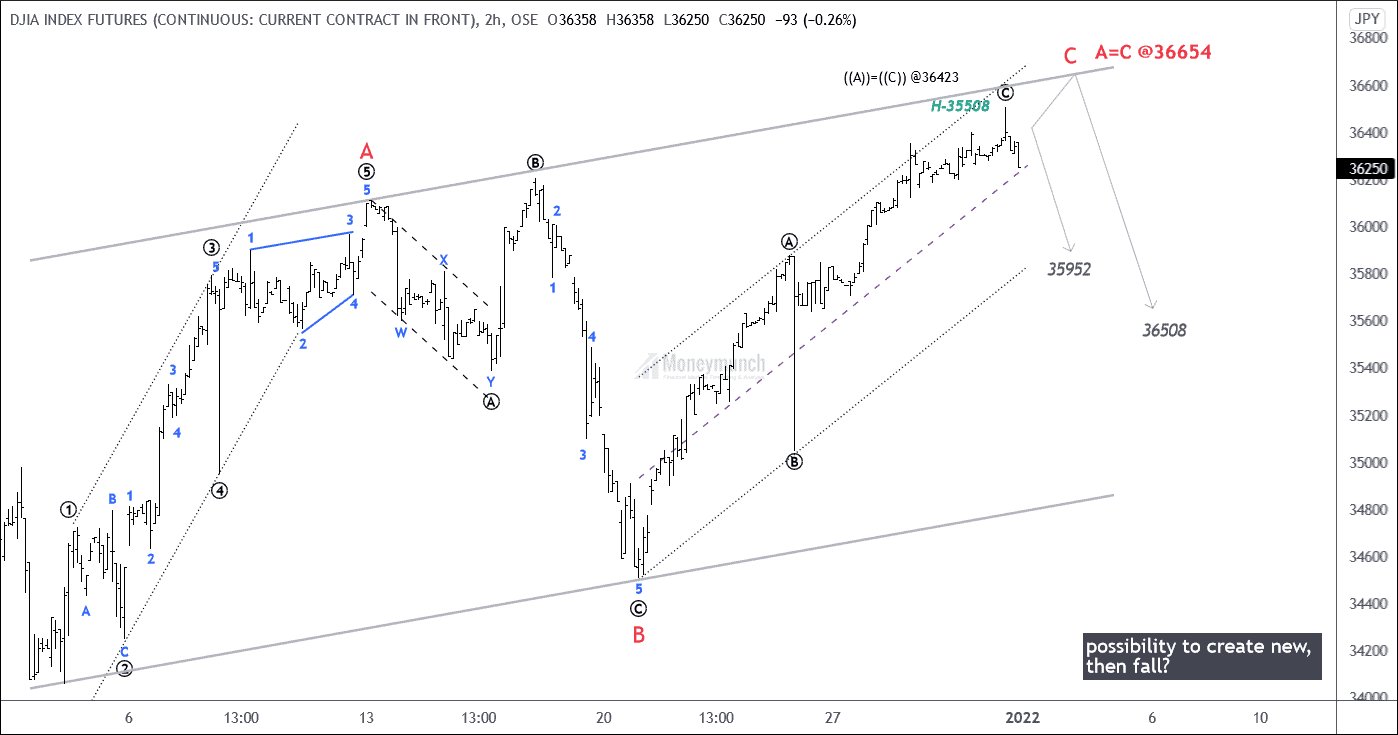
| Trader’s Roadmap Jan, 2022 – What I expect on Indian Market? Posted: 02 Jan 2022 10:18 PM PST NIFTY: Bullish Triple Zigzag (1H)The spot nifty hourly chart at an exciting juncture. The juncture isn’t easy to identify the next turn for beginners. Where will upturn sustain? Below levels are very crucial. That will help you make a new position or create a trade setup on Nifty. The first observation should be on the trend. And it is down by looking at the above chart (left to right). The price is defining a lower low. And that is W, Y, and Z. Moreover, the low high is similar (1X and 2X). Hence, I have chosen Oct 18605 high and Dec 16410 low. Wherein come out Bullish Triple Zigzag corrective pattern formation. Are you expecting a continuous downtrend? Then look at the equality ratio. That gives you resistance levels. And after the ending of the point of the Z wave, ((w))=((y)) at 17574. Furthermore, the level of 17600 is equal to waves A and C, but the 17503 level is the first upcoming resistance A = C | 0.789 ratio. Trend Reversal Key Level: According to the current market situation, the Nifty price is under 17640. It’s a direct sign of downtrend moves. And the first target will be the 17077 level. Nifty traders must look at this DJIA chart. Can you see the new high on DJIA? Further information I will update you soon. Would you like to get our share market updates instantly? Do you want to get premium NSE calls? If you have any questions or concerns about the stock market, don’t hesitate to contact me:
Have you any questions/feedback about this article? Please leave your queries in the comment box for answers. The post Trader’s Roadmap Jan, 2022 – What I expect on Indian Market? appeared first on Moneymunch. |
| You are subscribed to email updates from Moneymunch. To stop receiving these emails, you may unsubscribe now. | Email delivery powered by Google |
| Google, 1600 Amphitheatre Parkway, Mountain View, CA 94043, United States | |


