MoneyMunch.com |  |
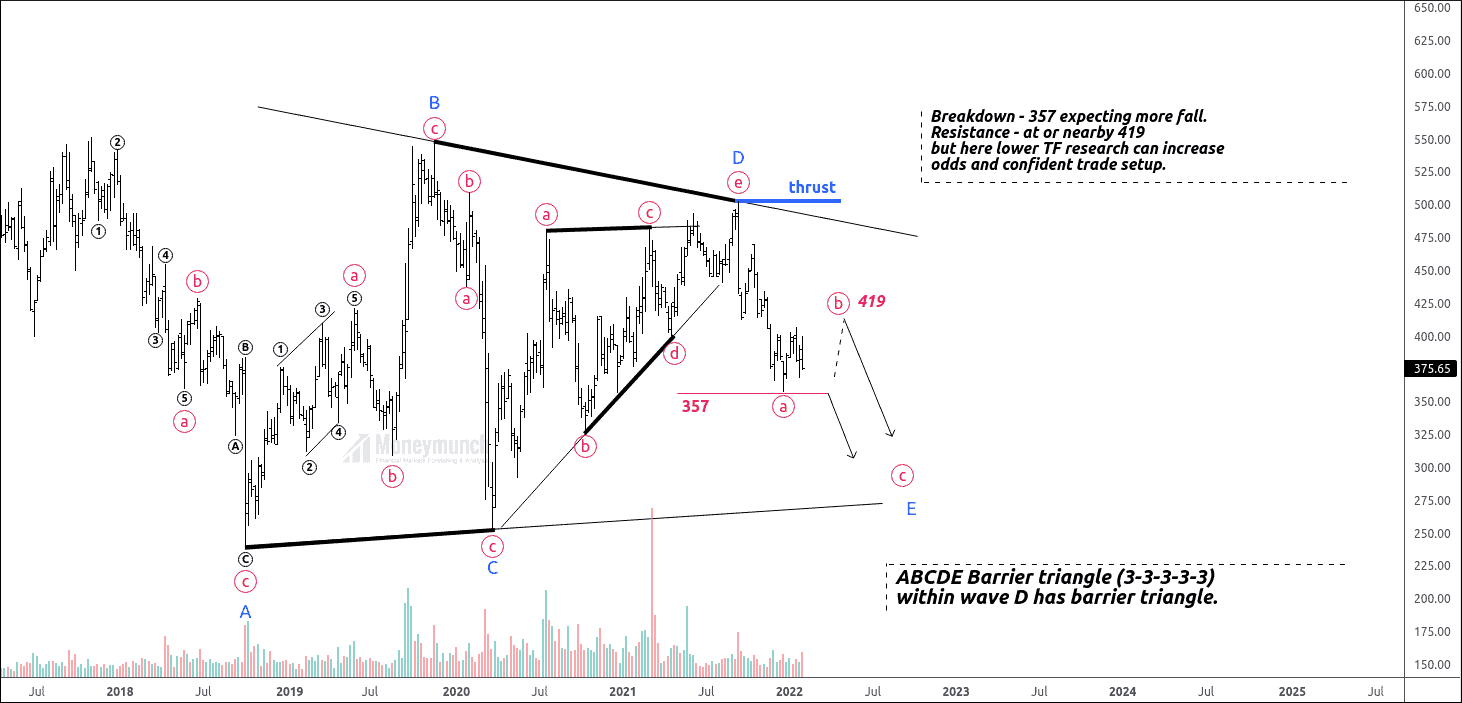
| NSE BPCL – Barrier Triangle within Barrier Triangle Posted: 07 Feb 2022 12:59 AM PST Timeframe -Weekly Today, I’m talking about real-time “Barrier Triangles” which developing on BPCL and very specific aspect of this triangle that I’ve encountered numerous times and that’s the frustrating aspect or characteristic of a triangle stuff to sometimes. In this instance, we are looking at a triangle where we actually have a triangle within triangle. Let me explain you my price chart over real quick, and you’ll see exactly what I’m talking about. Notice we have connected by trend line waves A and C is horizontal and waves B and D sloping downward therefore, we reveal barrier triangle. Breakdown – 357 expecting more fall. But here, lower TF research can increase odds and confident for trade setup. I will shortly update – lower TF here. Limited Time Offer – 1 Days Left Get flat 20% OFF on NSE Plans: Click here Would you like to get our share market updates instantly? Do you want to get premium NSE calls? If you have any questions or concerns about the stock market, don’t hesitate to contact me:
Have you any questions/feedback about this article? Please leave your queries in the comment box for answers. The post NSE BPCL – Barrier Triangle within Barrier Triangle appeared first on Moneymunch. |
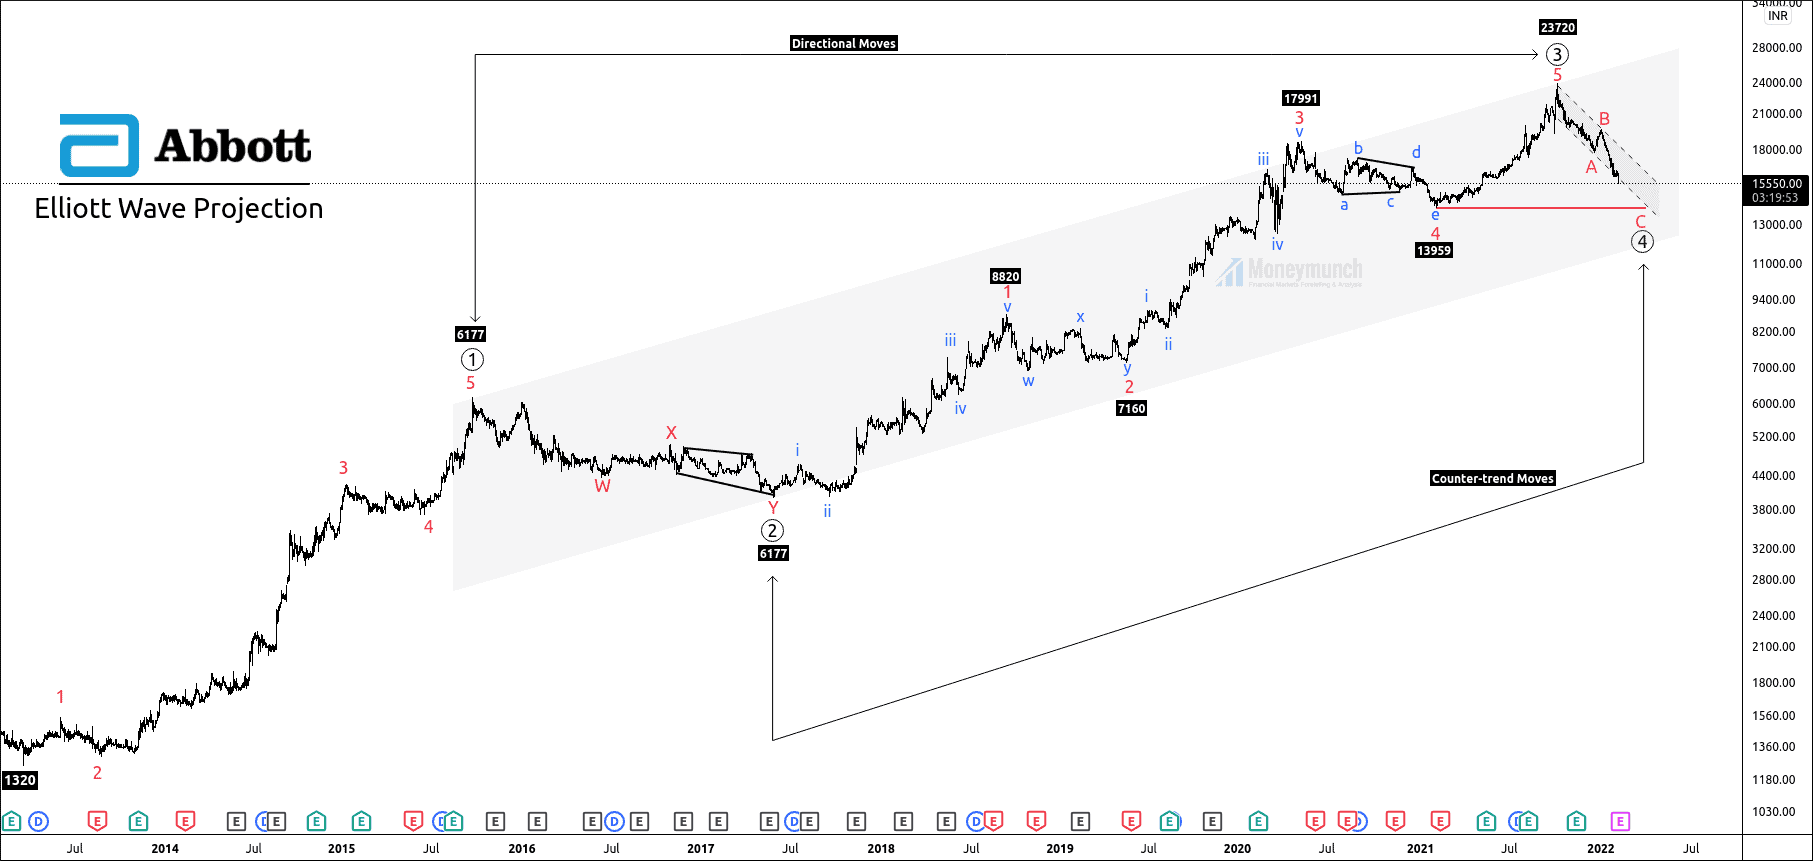
| NSE: Abbott India Elliott Wave Projection Posted: 07 Feb 2022 12:02 AM PST Overview: Abbott India has accomplished the impulsive wave 3, and the price is forming corrective wave 4. Price has occurred the sub-wave A. and Sub-wave B. Sub-wave C of 4th wave is in progress. After completion of wave 4, the price will start its bull run. Fibonacci relationship and wave Formations: Wave ((1)) is a five-wave impulse. Wave ((2)) retraced 50% of wave ((1)). Wave ((3)) is a five-wave impulse. Wave ((4)) looks like a sharp correction. Rule of alternation indicates variation between two corrective waves in terms of time, distance, and formation. Because wave ((2)) was a complex correction, wave ((4)) should be a sharp correction. Destiny of wave ((4)): Wave ((4)) can terminate near the previous corrective wave (iv) at 13994. Wave 4 can end at, 15064, which is a crucial support level. The common retracement of wave ((4)) is 38.2%, but the price has broken down to this level. Next Fibonacci retracement level is 50% at, 13967. Please note that the corrective channel has broken down, so bulls can enter when the price renter into the parallel lines. Otherwise, the price has bearish sentiments. The premium members will receive entry-level, stop loss, and targets due to market hours through our mobile app. Opportunities Are Like Sunshine. If You Wait Too Long, You Miss Them. Only premium subscribers can read the full article. Please log in to read the entire text. If you don’t have a login yet, please subscribe now to get access. Limited Time Offer – 1 Days Left Get flat 20% OFF on NSE Plans: Click here Would you like to get our share market updates instantly? Do you want to get premium NSE calls? If you have any questions or concerns about the stock market, don’t hesitate to contact me:
Have you any questions/feedback about this article? Please leave your queries in the comment box for answers. The post NSE: Abbott India Elliott Wave Projection appeared first on Moneymunch. |
| You are subscribed to email updates from Moneymunch. To stop receiving these emails, you may unsubscribe now. | Email delivery powered by Google |
| Google, 1600 Amphitheatre Parkway, Mountain View, CA 94043, United States | |


 Lock
Lock