Please log in to read the entire text. If you don’t have a login yet, please subscribe now to get access.
MoneyMunch.com |  |
| UBL FUT Trade Setup For Premium Members Posted: 09 Feb 2022 10:01 PM PST Only premium subscribers can read the full article. Please log in to read the entire text. If you don’t have a login yet, please subscribe now to get access. Would you like to get our share market updates instantly? Do you want to get premium NSE calls? If you have any questions or concerns about the stock market, don’t hesitate to contact me:
Have you any questions/feedback about this article? Please leave your queries in the comment box for answers. The post UBL FUT Trade Setup For Premium Members appeared first on Moneymunch. |
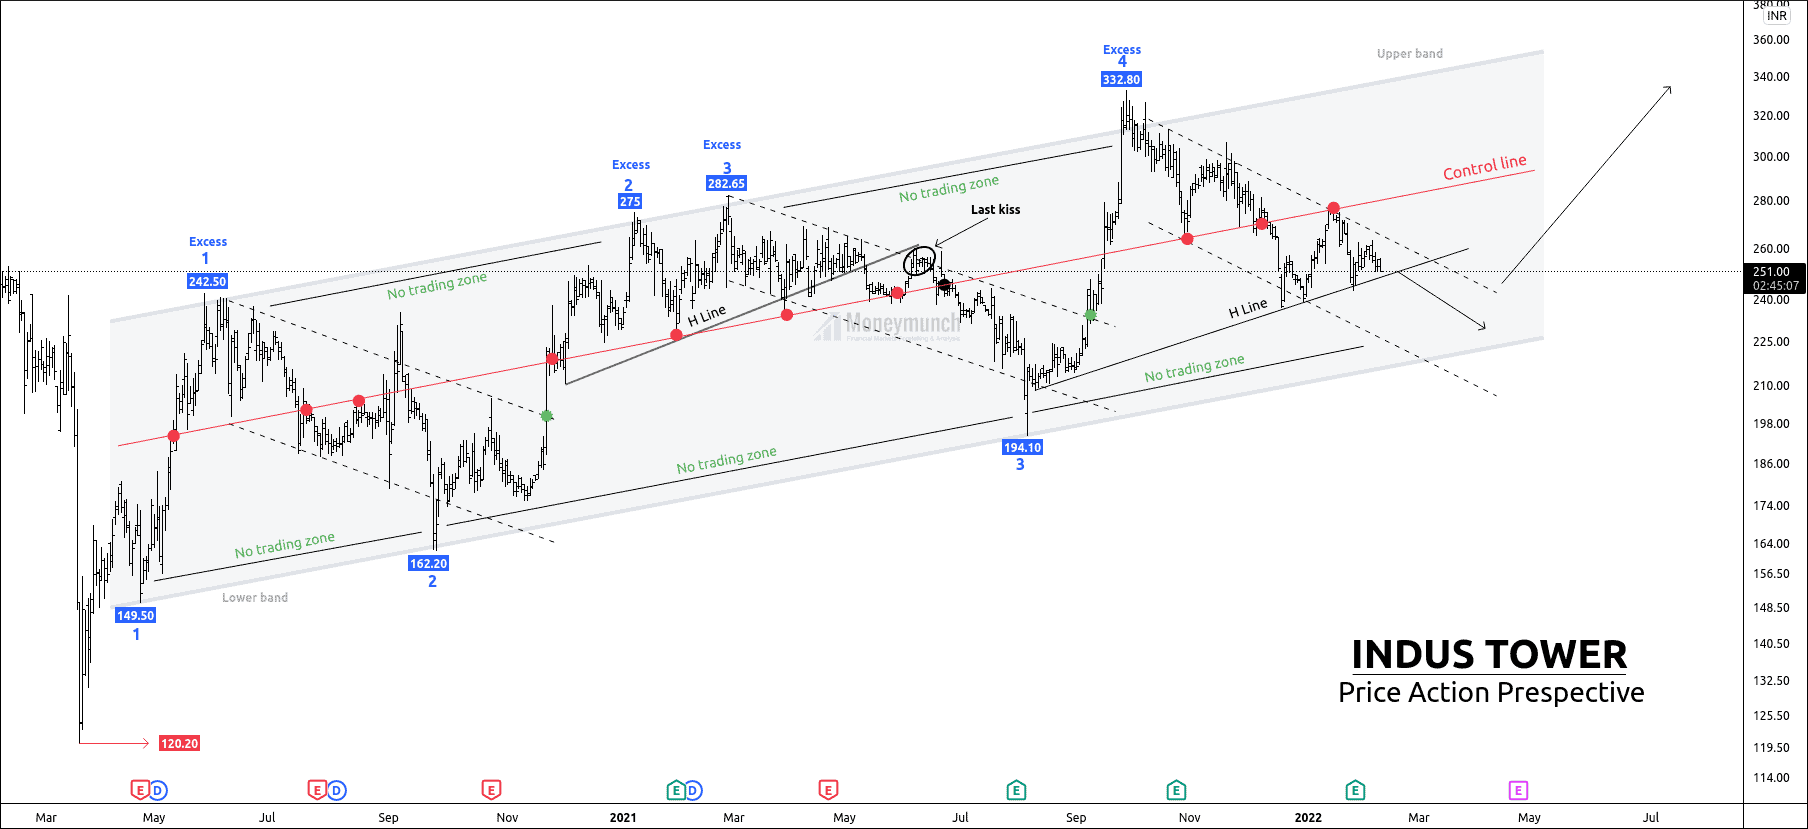
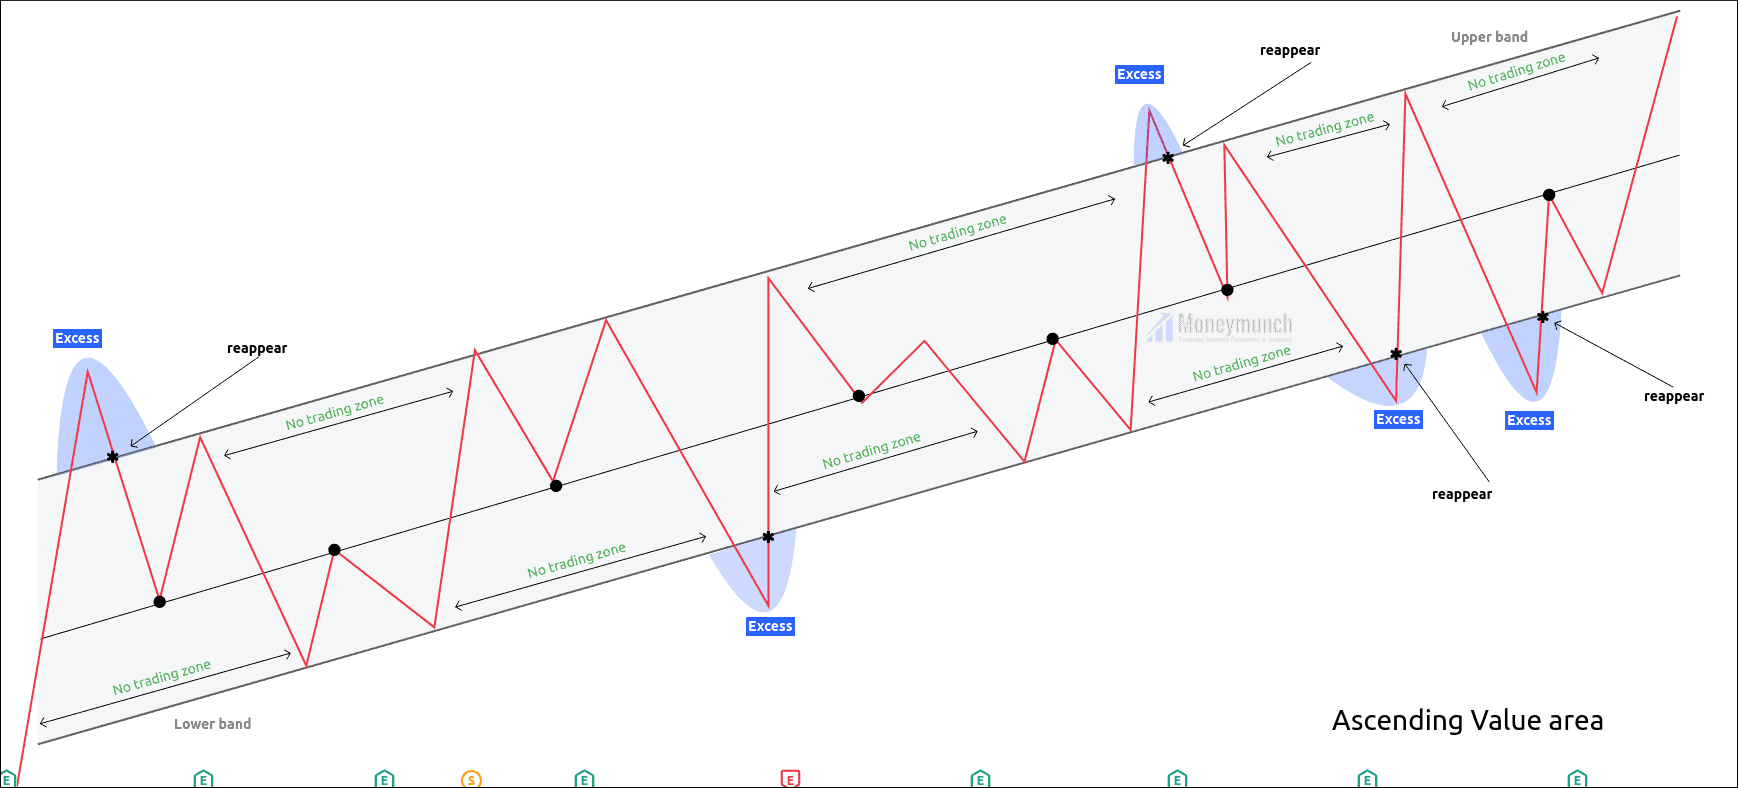
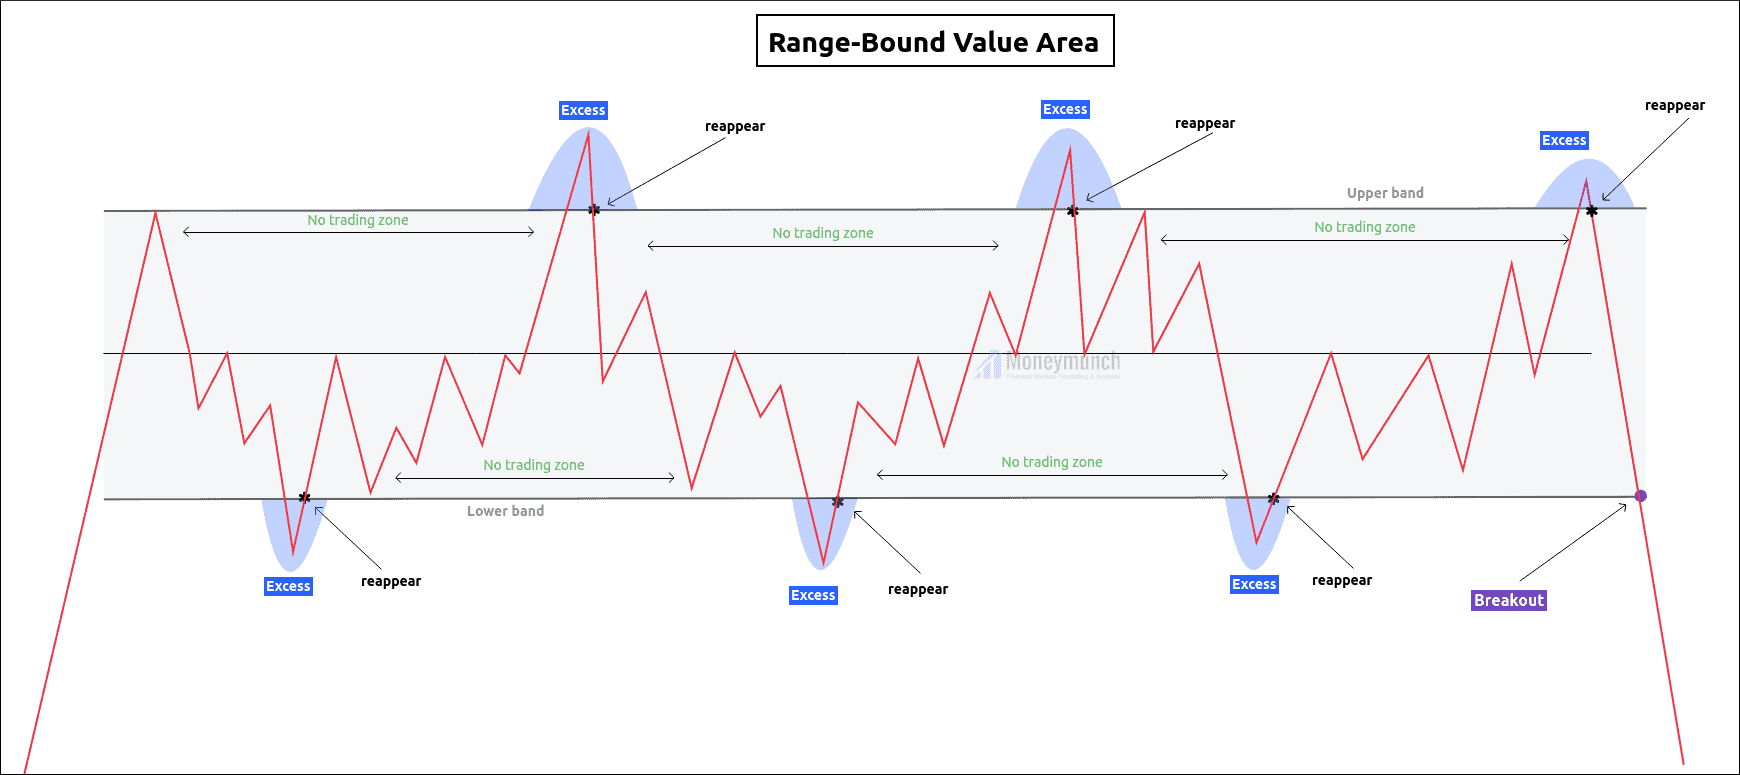
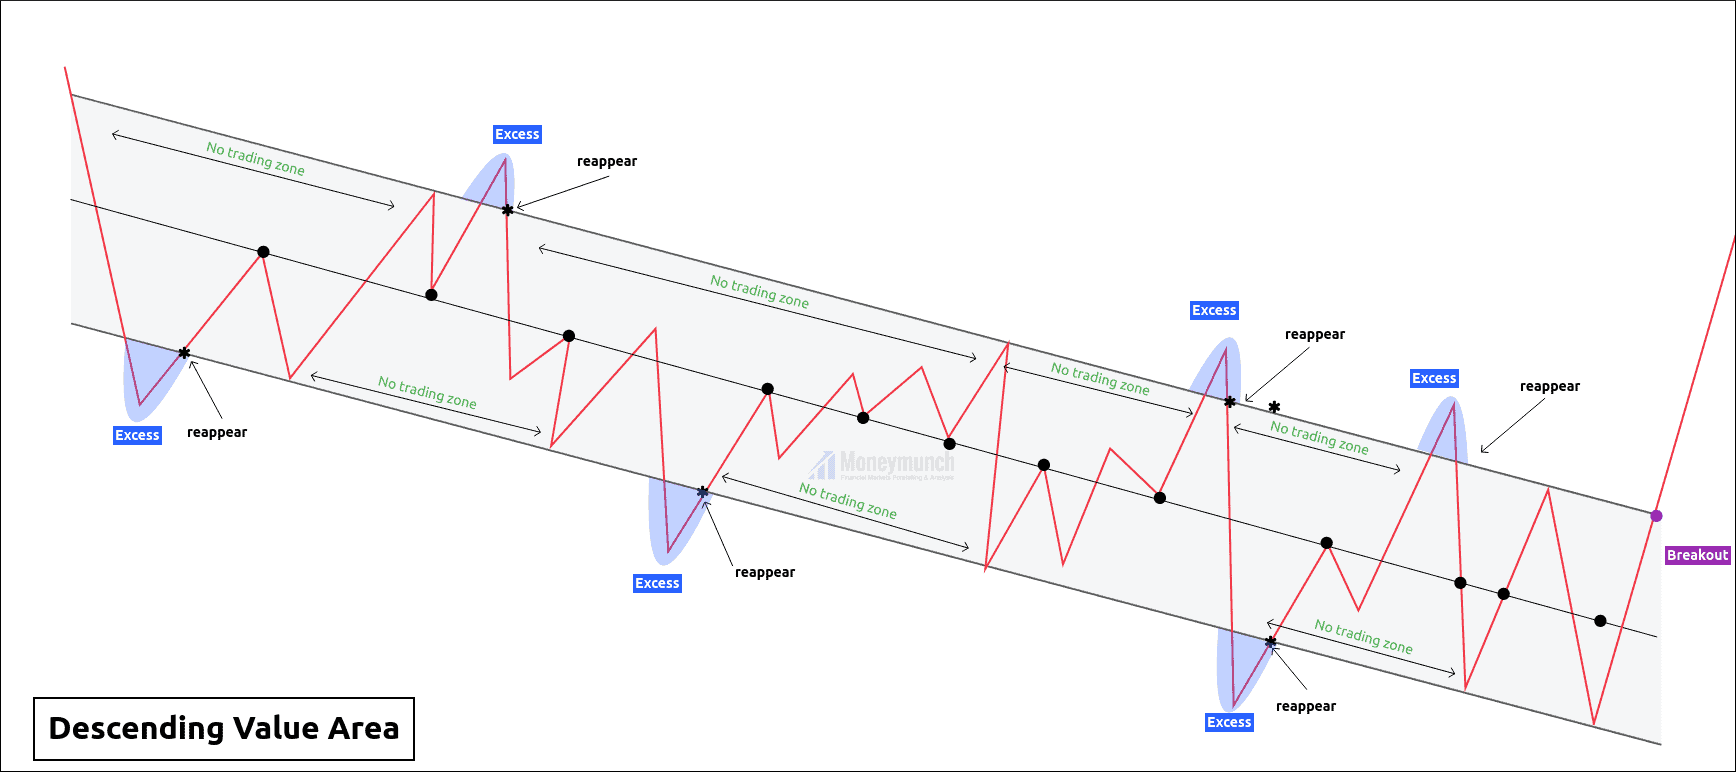
| The Ultimate Price Action Breakdown Strategy Posted: 09 Feb 2022 02:47 AM PST Preface: Alright, the operation started after creating an extreme low at 120.20. Price has created an upward channel from the extreme low, where the equilibrium has occurred between bull and bear traders. Control line has given eleven touches, which shows the strong gravitation at the middle. Here, we can see four reversals on the upper band, and three reversal points occurred on the lower band. We have two opportunities: 1. Now, the price is on the H-line, and the breakout of the h line indicates the lower band touch. 2. Bull can buy at excess, or they can enter at reappearing in the value area for the target of the control line. Every beginner who wants to start trading with naked strategy (without indicator) can use this method because the price is the thing that will pay you. Value area: A zone in which bulls and bears both are satisfied to stay within it. Value area has two bands: 1. Upper band 2. Lower band Ascending Value area: Range-Bound Value area: Descending Value Area: Upper band: Upper band indicates demand-supply. Lower Band: No trading zone: H Line. Excess: Excess is regret and fake-out. In simple words, price breaks the upper band and again re-enter into the parallel channel. Buying or selling at the excess is the perfect deal. An excess is a signal of reversal. The psychology behind the control line: Control line: The Control line is the gravitation point of any value area. We can draw by connecting the reversal points in the middle. Please note that the price can not stay away from the control line of the value area. We can use it as a price target or breakout trade. Here, the price has given eleven touches on the control line. Breakout or breakdown of the channel: Only premium subscribers can read the full article. Please log in to read the entire text. If you don’t have a login yet, please subscribe now to get access. Would you like to get our share market updates instantly? Do you want to get premium NSE calls? If you have any questions or concerns about the stock market, don’t hesitate to contact me:
Have you any questions/feedback about this article? Please leave your queries in the comment box for answers. The post The Ultimate Price Action Breakdown Strategy appeared first on Moneymunch. |
| You are subscribed to email updates from Moneymunch. To stop receiving these emails, you may unsubscribe now. | Email delivery powered by Google |
| Google, 1600 Amphitheatre Parkway, Mountain View, CA 94043, United States | |
 Lock
Lock


