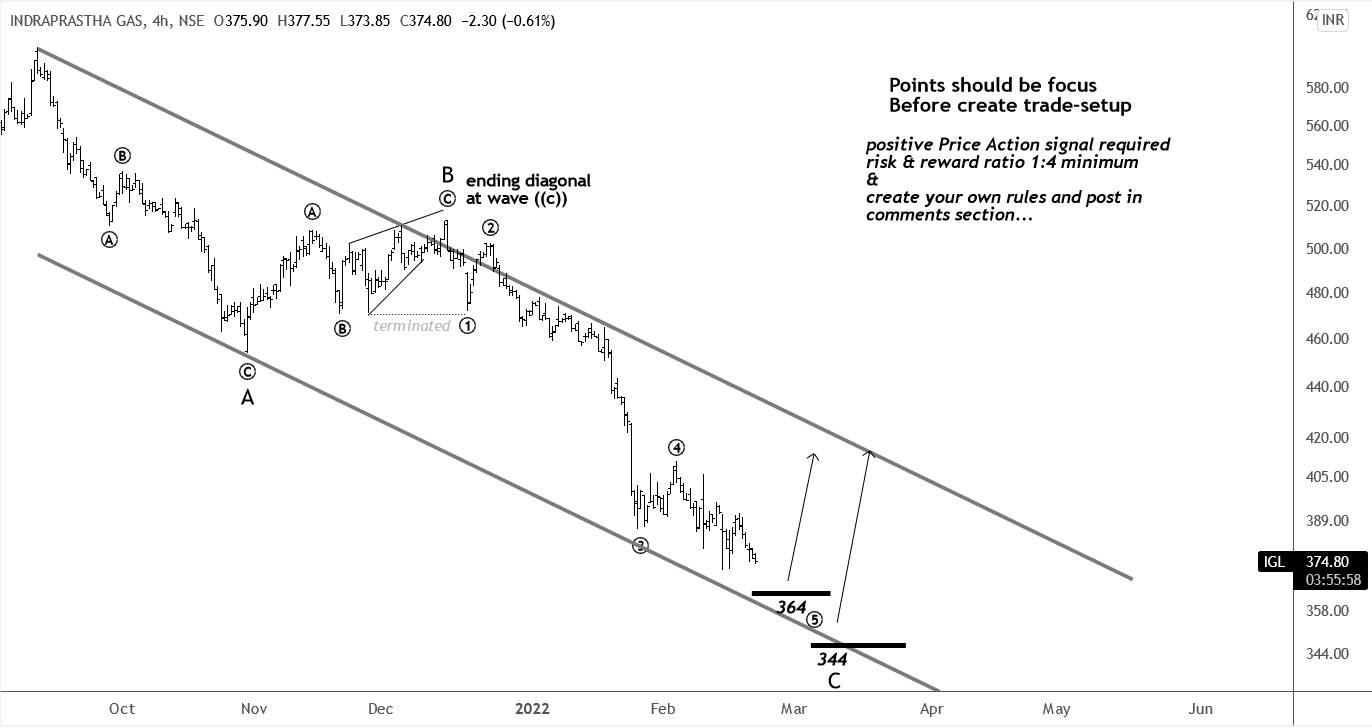
I spend much of my spare time analyzing markets as many of you know. Yes, analysis is my day job, but it is also my passion. So, whenever the weekend comes around, I spend most of my time studying price charts in front of the computer. Though was looking for the swing trade setup for F&O NSE, At a lower timeframe I found Ending-Diagonal on IGL which is a highly reliable one of 13 patterns for R.N Elliott. So I decided to explain it.
MoneyMunch.com |  |
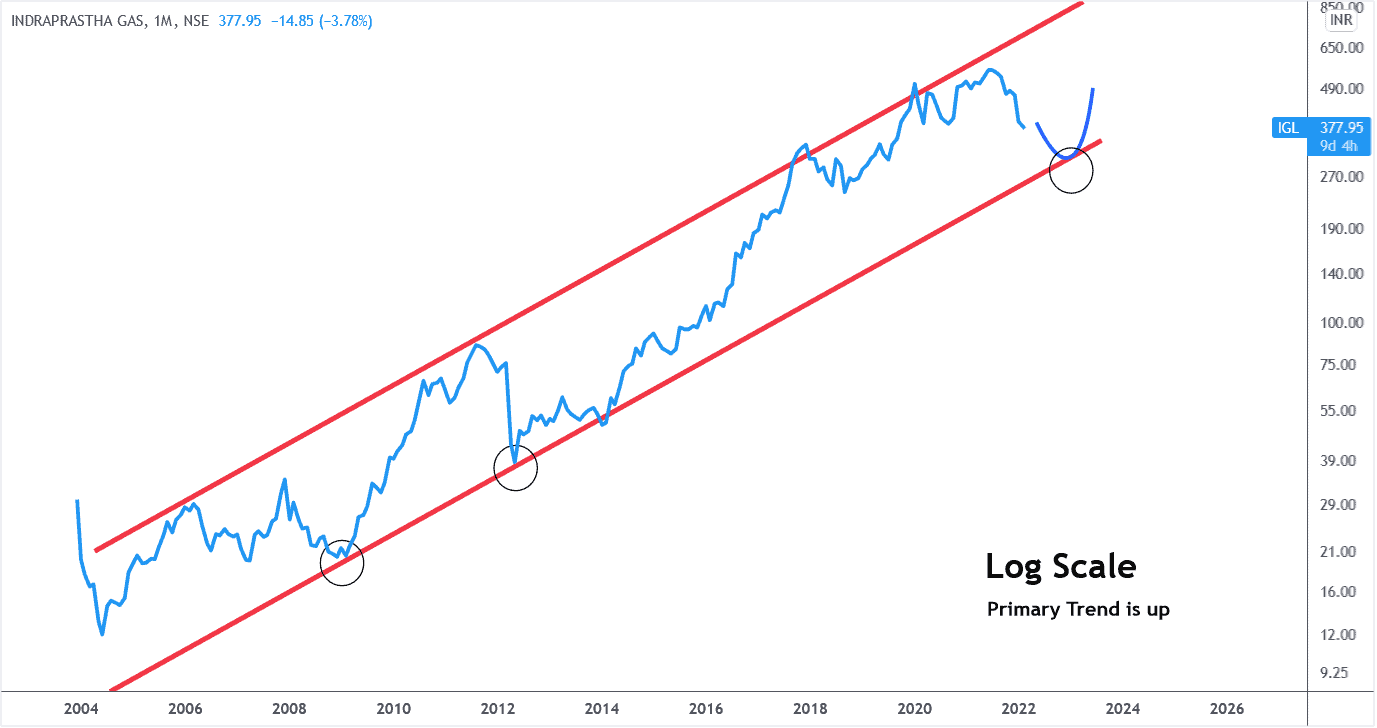
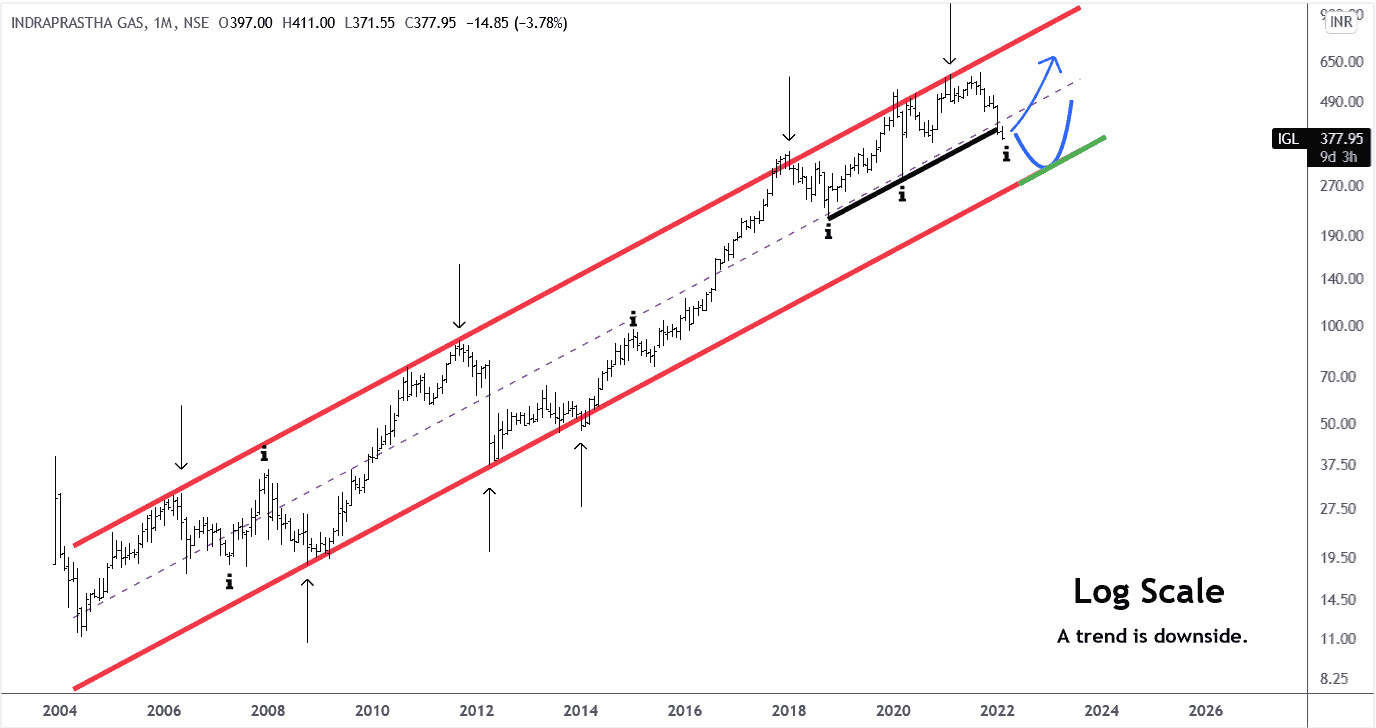
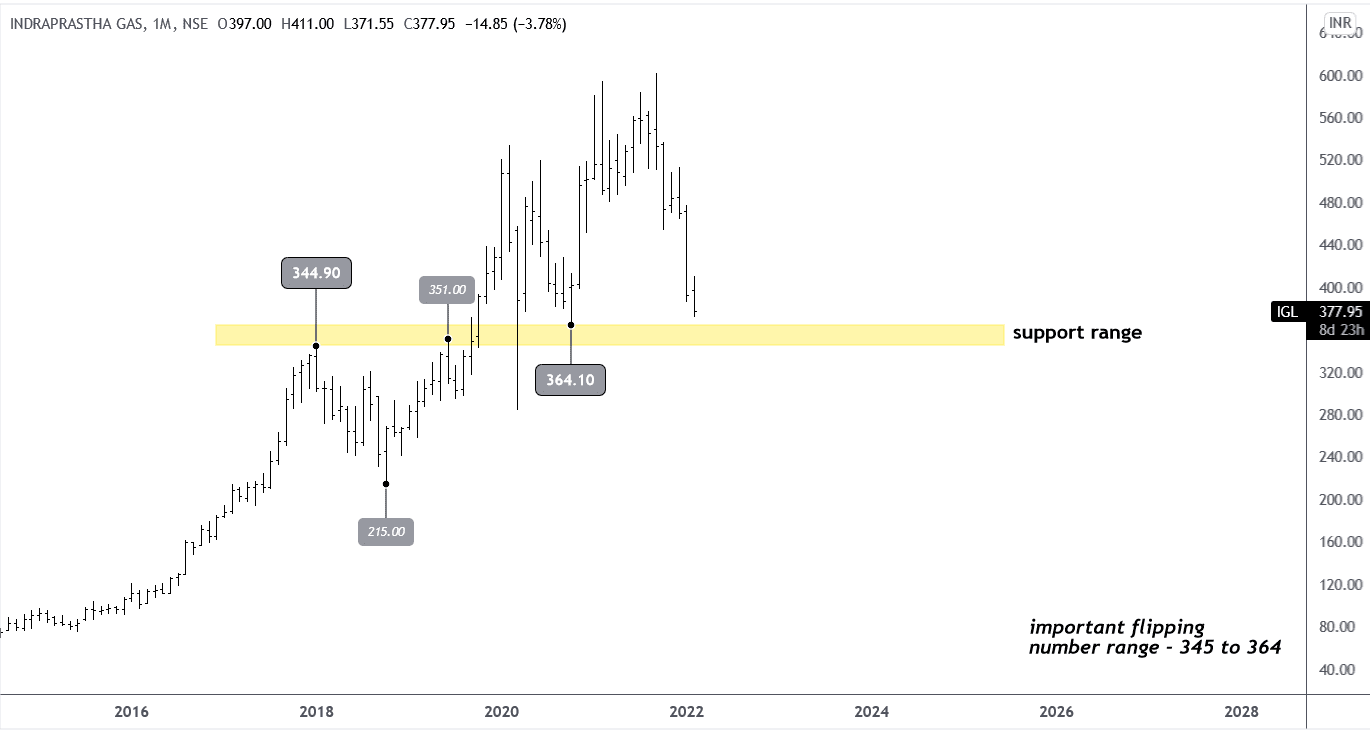
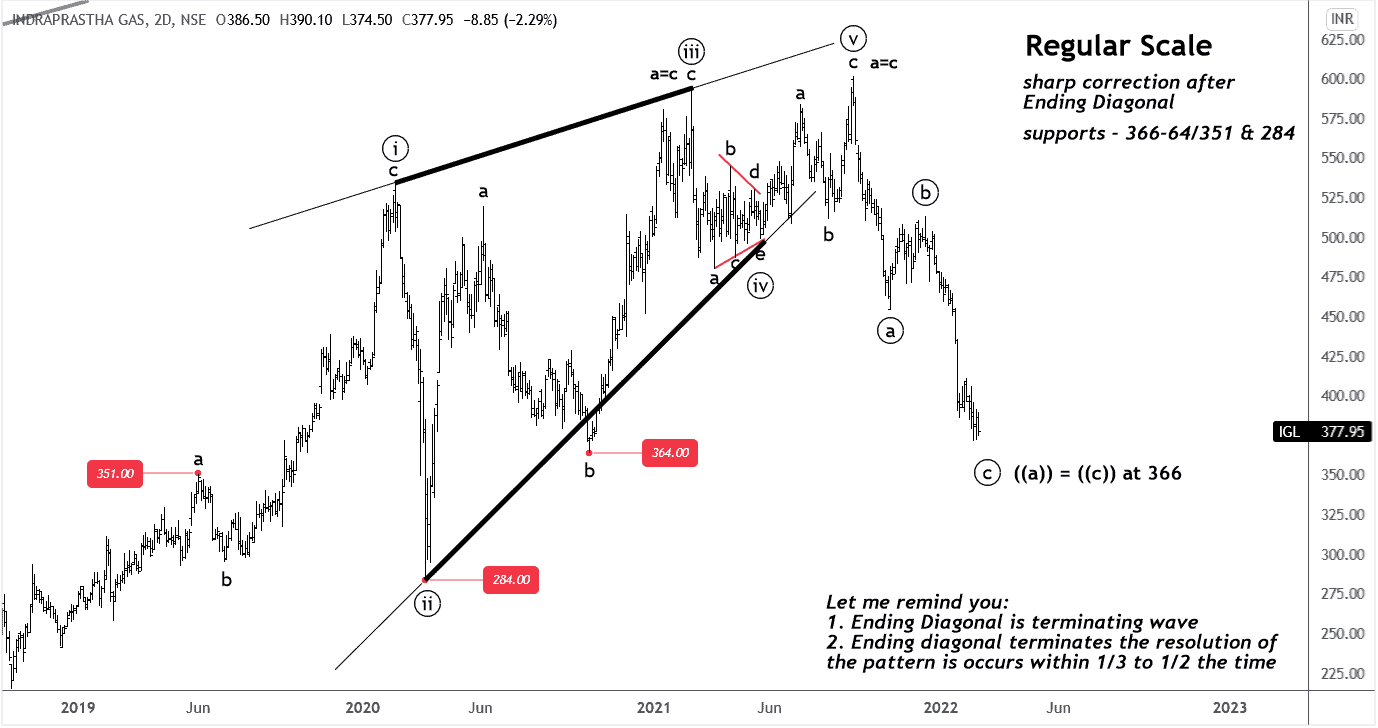
| Swing Traders, IGL counter-setup on next stop: at corrective wave pattern. Posted: 20 Feb 2022 08:26 PM PST The trend identifying Monthly Line-Chart on Log-Scale Because of line chart simplicity, we’re just looking to identify the trend purpose which is a clear visualization of the primary trend. A popular trading expression is “the trend is your friend.” Therefore, your long(buying) side trade will be referred to as the main or primary trade setup. The Monthly bar-chart Log-Scale for more clarity on what is going on inside up-trend and its up-down personality. The bar-chart Log-Scale for more clarity on what is going on inside up-trend. The support is still too far at or near the lower boundary line at the parallel price channel but Sometimes, the middle line would work as support also. This is essentially what I work with support at the bottom line or middle line. A price is near the middle line or a little below it that is why I would like to create a long trade-set-up. Don’t ignore this outcome from the bar-chart: A trend is a downside in the range of parallel channels. Before getting started to apply the wave principle, let’s look up previous significant support & resistance at the Monthly Arithmetic Scale. In a technical analysis term “Flip Range” refers to the small price range that dramatically changes its direction and touches it repeatedly. A Significant “Flip Range”: 345 to 364 where I am gonna create a long setup for a pullback. The wave principle is applied on IGL at the monthly log-scale time frame. As you can see in the price chart, I labeled using Elliott wave principles and recognized that a price is trading in the corrective mode. More importantly, the wave ((ii)) is exactly 61.8% multiple & wave ((iii)) is just beyond the 3.618 extended ratios but wave ((iv)) is deeper at 78.6% which is not a common or expected ratio on a log scale. A wave ((v)) is an extended wave. Let’s jump on the 2-Days time frame for clear visualization of the Ending Diagonal.
In real-time trading, I’ll create trade-setups utilizing the above supports. For instance, I’ll look for a pullback entry in the price range from 344 to 364 long side but during the trading hours, I always focus on price action to take action. To take action 4-hours chart at regulate scale: Only premium subscribers can read the full article. Please log in to read the entire text. If you don’t have a login yet, please subscribe now to get access. The post Swing Traders, IGL counter-setup on next stop: at corrective wave pattern. appeared first on Moneymunch. |
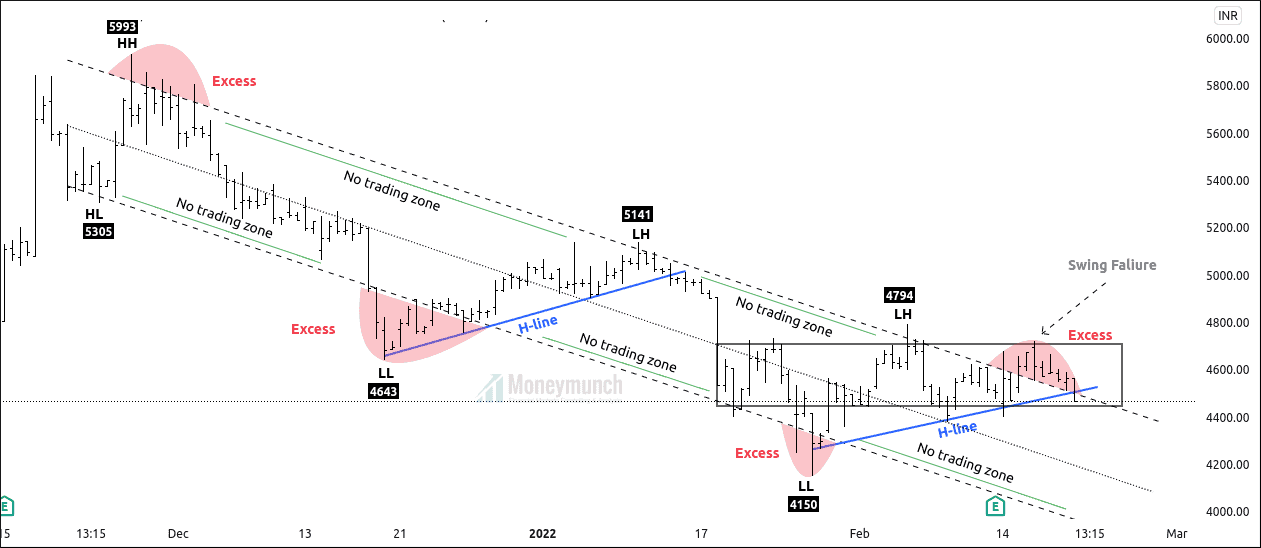
| NSE Apollo Hospital Is Preparing The Last Leg Of Correction. Posted: 20 Feb 2022 06:34 PM PST Apollo hospital is currently forming on the downward channel. After creating the highest high of 5993, Apollo hospital couldn’t break this level, and supply exceeded the demand. Price has begun creating lower highs and lower lows to confirm its bearish run. Excess: In this channel, we have four price excess. Excess is a signal of a sharp reversal. It indicates that the price can go more in current. Either bulls or bears have to step back to maintain equilibrium. Excess 1: 5993 Excess 2: 4643 Excess 3: 4150 Excess 4: 4722 H-Lines: Price has created two h – lines. H-top line holds the bulk of trading activities. After breaking H-lines, it can give a sharp move. It also works as dynamic support and resistance. No trading zone: No trading zone indicates negligible trading activities. Here, traders are not interested in trading decisions. Price has created five no trading zones. Upper band & Lower band: The upper band is the dynamic area where supply exceeds demand. The upper band provides resistance to the price. But, If the price breaks the upper band, the price will likely continue the current trend. The Lower band is the dynamic area where demand exceeds supply. The upper band provides support to the price. But, If the price breaks the lower band, the price will likely continue the current trend. Perspective: Currently, the price is on the upper band of the parallel channel. The price has created an excess (4724) on the upper band of the channel, which indicates. If the price sustains under the upper band of the channel, Traders can trade for the following targets: 4401-4345- 4208 and more.
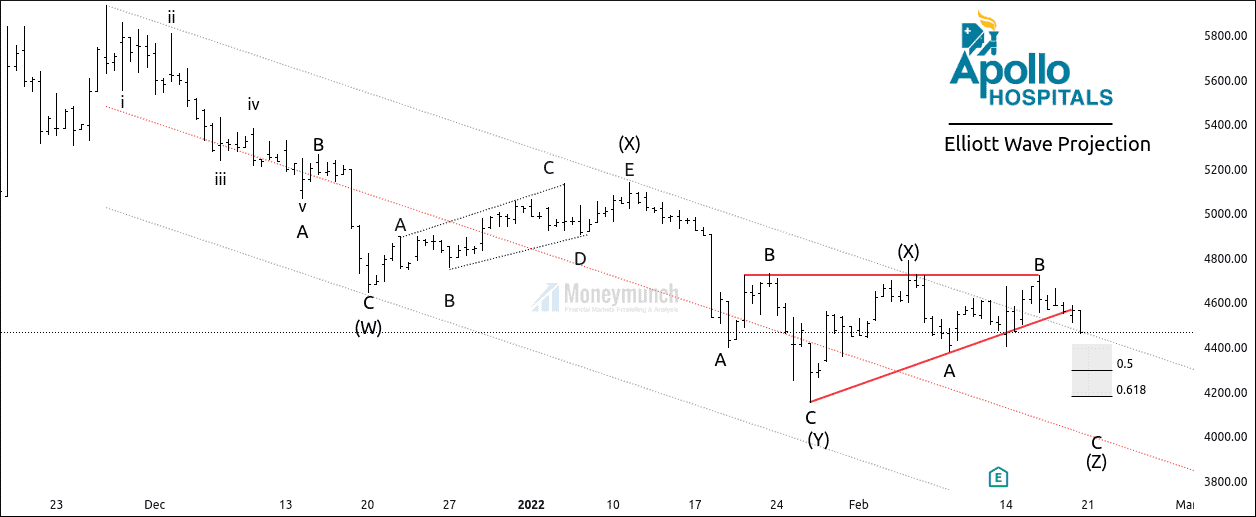
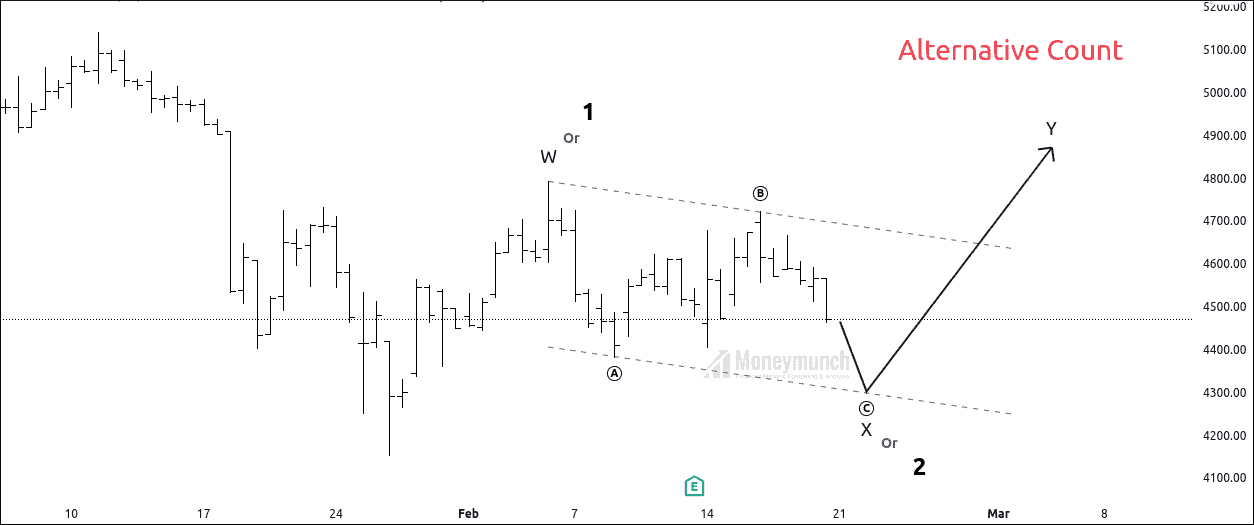
If the price breaks the previous lower high, it can change the trend by making a new high. Apollo hospital has formed a triple zigzag, and wave (X) of complex correction has completed at 4794. Wave (W): 4643 Wave (X): 5141 Wave (X): 4150 Wave (Y): 4794 Wave (Z): – We are riding the sub-wave C of wave (Z) of a complex correction. Traders can enter a short position after a pullback for the mentioned target of 4401-4345- 4208. Only premium subscribers can get invalidation, entry, and exit points in our app. If the supply fails to break the lower low of the Wave(Y), We can follow the alternative Count. Only premium subscribers can read the full article. Please log in to read the entire text. If you don’t have a login yet, please subscribe now to get access. Would you like to get our share market updates instantly? Do you want to get premium NSE calls? If you have any questions or concerns about the stock market, don’t hesitate to contact me:
Have you any questions/feedback about this article? Please leave your queries in the comment box for answers. The post NSE Apollo Hospital Is Preparing The Last Leg Of Correction. appeared first on Moneymunch. |
| You are subscribed to email updates from Moneymunch. To stop receiving these emails, you may unsubscribe now. | Email delivery powered by Google |
| Google, 1600 Amphitheatre Parkway, Mountain View, CA 94043, United States | |

 Lock
Lock