MoneyMunch.com |  |
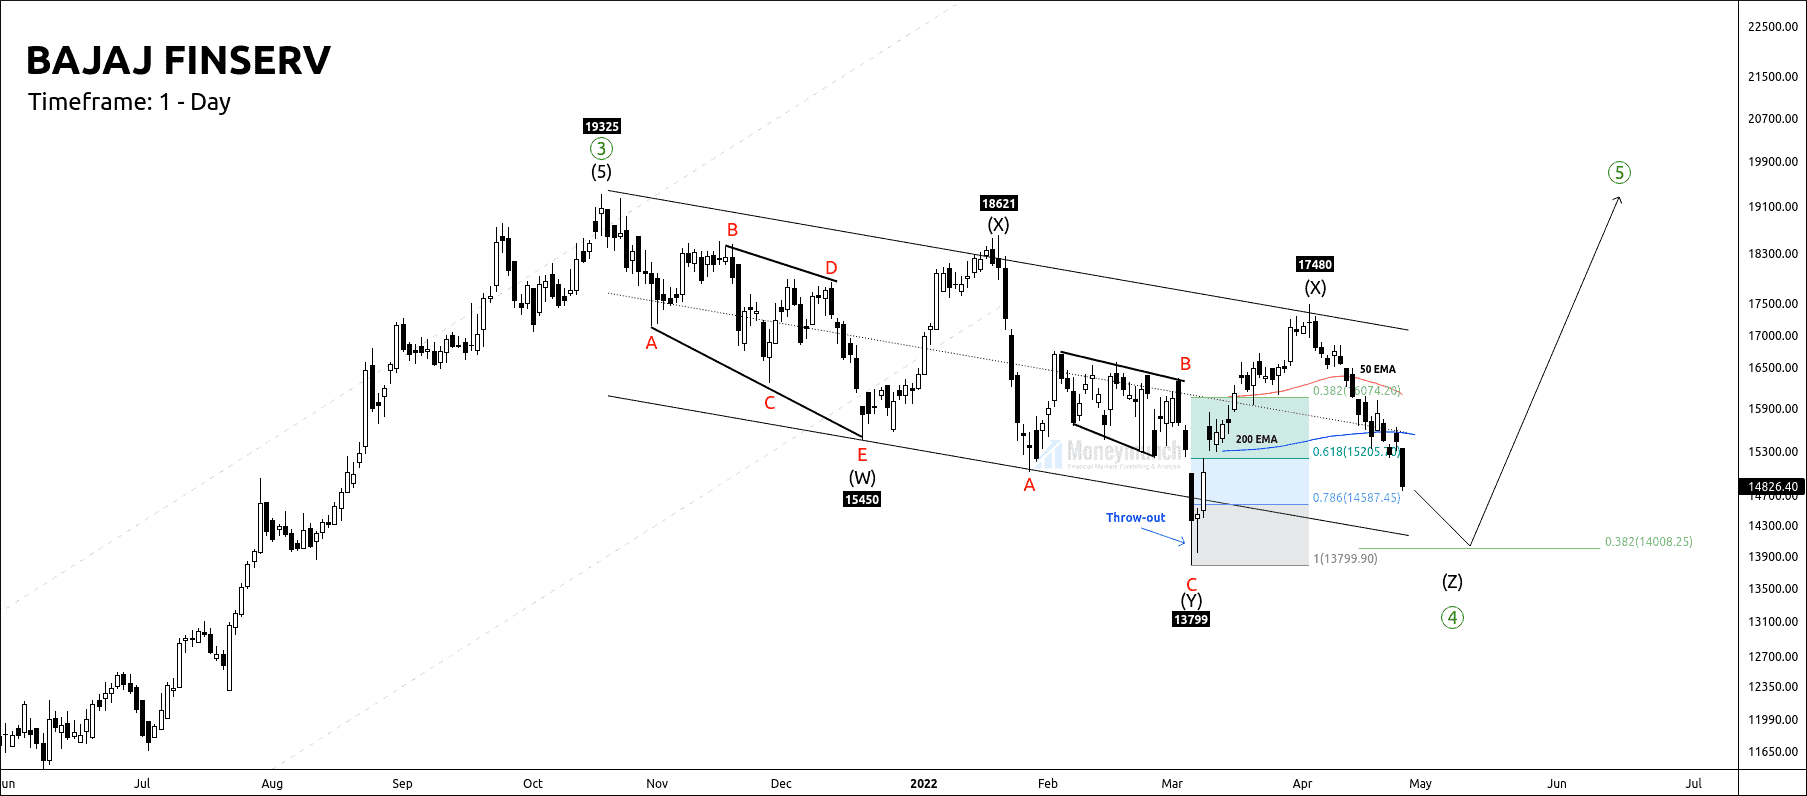
| NSE Bajaj Finserv: Elliott Wave Analysis & Tips Posted: 27 Apr 2022 05:25 AM PDT Bajaj Finserv has started it’s final bearish, where we have seen a speculative boom downside. After breaking 50 & 200 EMA, it started falling for wave Z. Traders can expect the following targets: 14631 – 14449 – 14176. Bajaj Finserv has formed in the descending channel for more than 27 weeks. It has also broken the control line’s channel. That indicates bulls are not ready to expect a falling knife. Measurement of wave ((4)): The ending point of the corrective structure is the starting point of an impulsive phase. After the completion of wave (z) of wave (4), the price will march for motive wave (5). If the price sustains above wave (X) at 17480, Bajaj Finserv will move on for an all-time high. I will upload further information soon. Would you like to get our share market updates instantly? Click the link to join: Free Stock Tips Do you want to get premium NSE calls? Click the link to subscribe: Premium NSE Stock Tips If you have any questions or concerns about the stock market, don't hesitate to contact me:
The post NSE Bajaj Finserv: Elliott Wave Analysis & Tips appeared first on Moneymunch. |
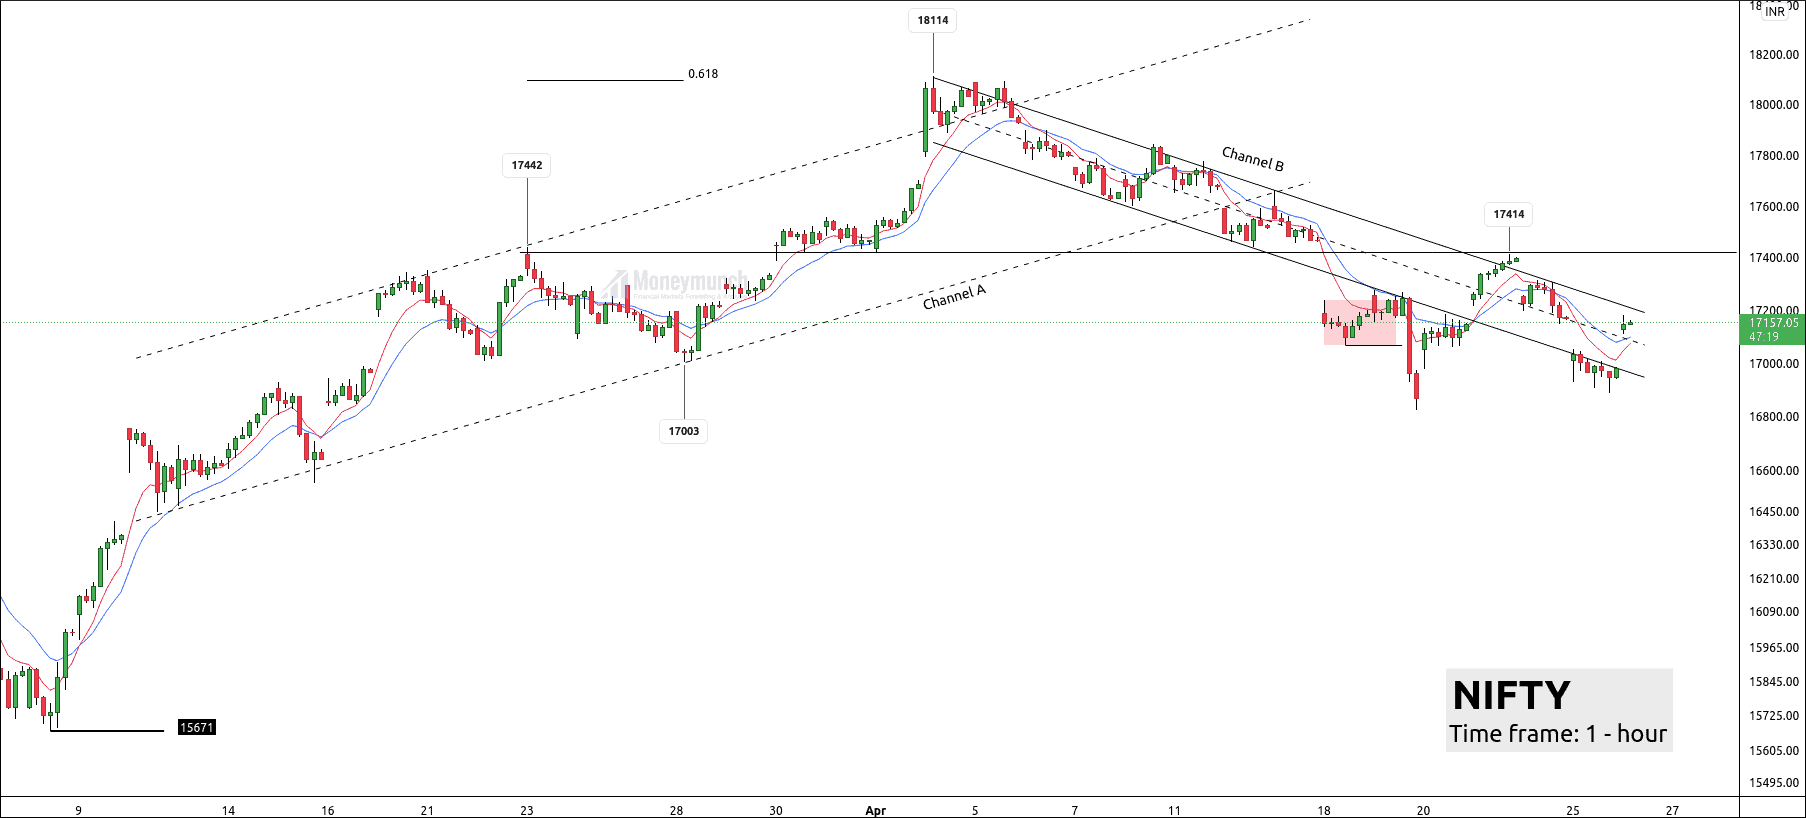
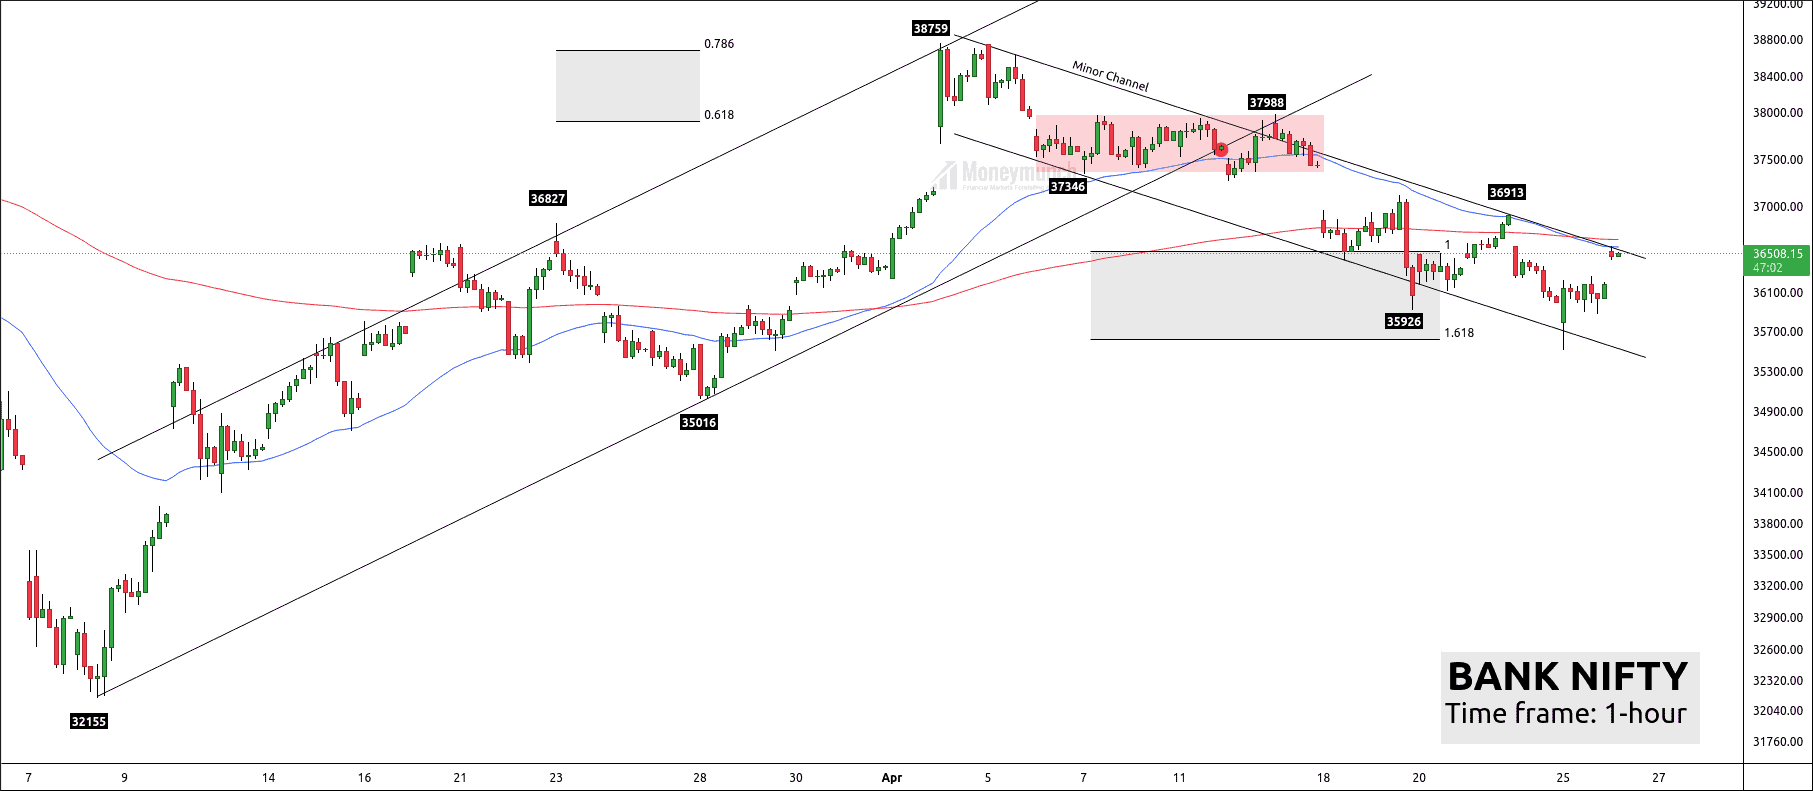
| Nifty & BankNifty – Intraday Trend Analysis Posted: 25 Apr 2022 10:20 PM PDT Nifty has formed the minor channel wherein price has made excess. This excess has driven prices into the minor channel. The upper band of the channel indicates the supply zone. Rejection from the upper band has a strong bearish indication. In this case, nifty has the support of 17000 & 16800. If the price breaks the upper band of the parallel channel, we can see the price can push to our pivot zone 17420. A breakout of the pivot range is a bullish indication for traders. Bank Nifty is also facing resistance from the upper band of the parallel channel. Bank Nifty is bearish below 36420 for the support levels of 36250 – 36000 – 36800. Would you like to get our share market updates instantly? Click the link to join: Free Stock Tips Do you want to get premium NSE calls? Click the link to subscribe: Premium NSE Stock Tips If you have any questions or concerns about the stock market, don't hesitate to contact me:
The post Nifty & BankNifty – Intraday Trend Analysis appeared first on Moneymunch. |
| You are subscribed to email updates from Moneymunch. To stop receiving these emails, you may unsubscribe now. | Email delivery powered by Google |
| Google, 1600 Amphitheatre Parkway, Mountain View, CA 94043, United States | |


