MoneyMunch.com

Link to Moneymunch

Gold Price Predictions for 2022

Posted: 08 May 2022 12:45 AM PDT

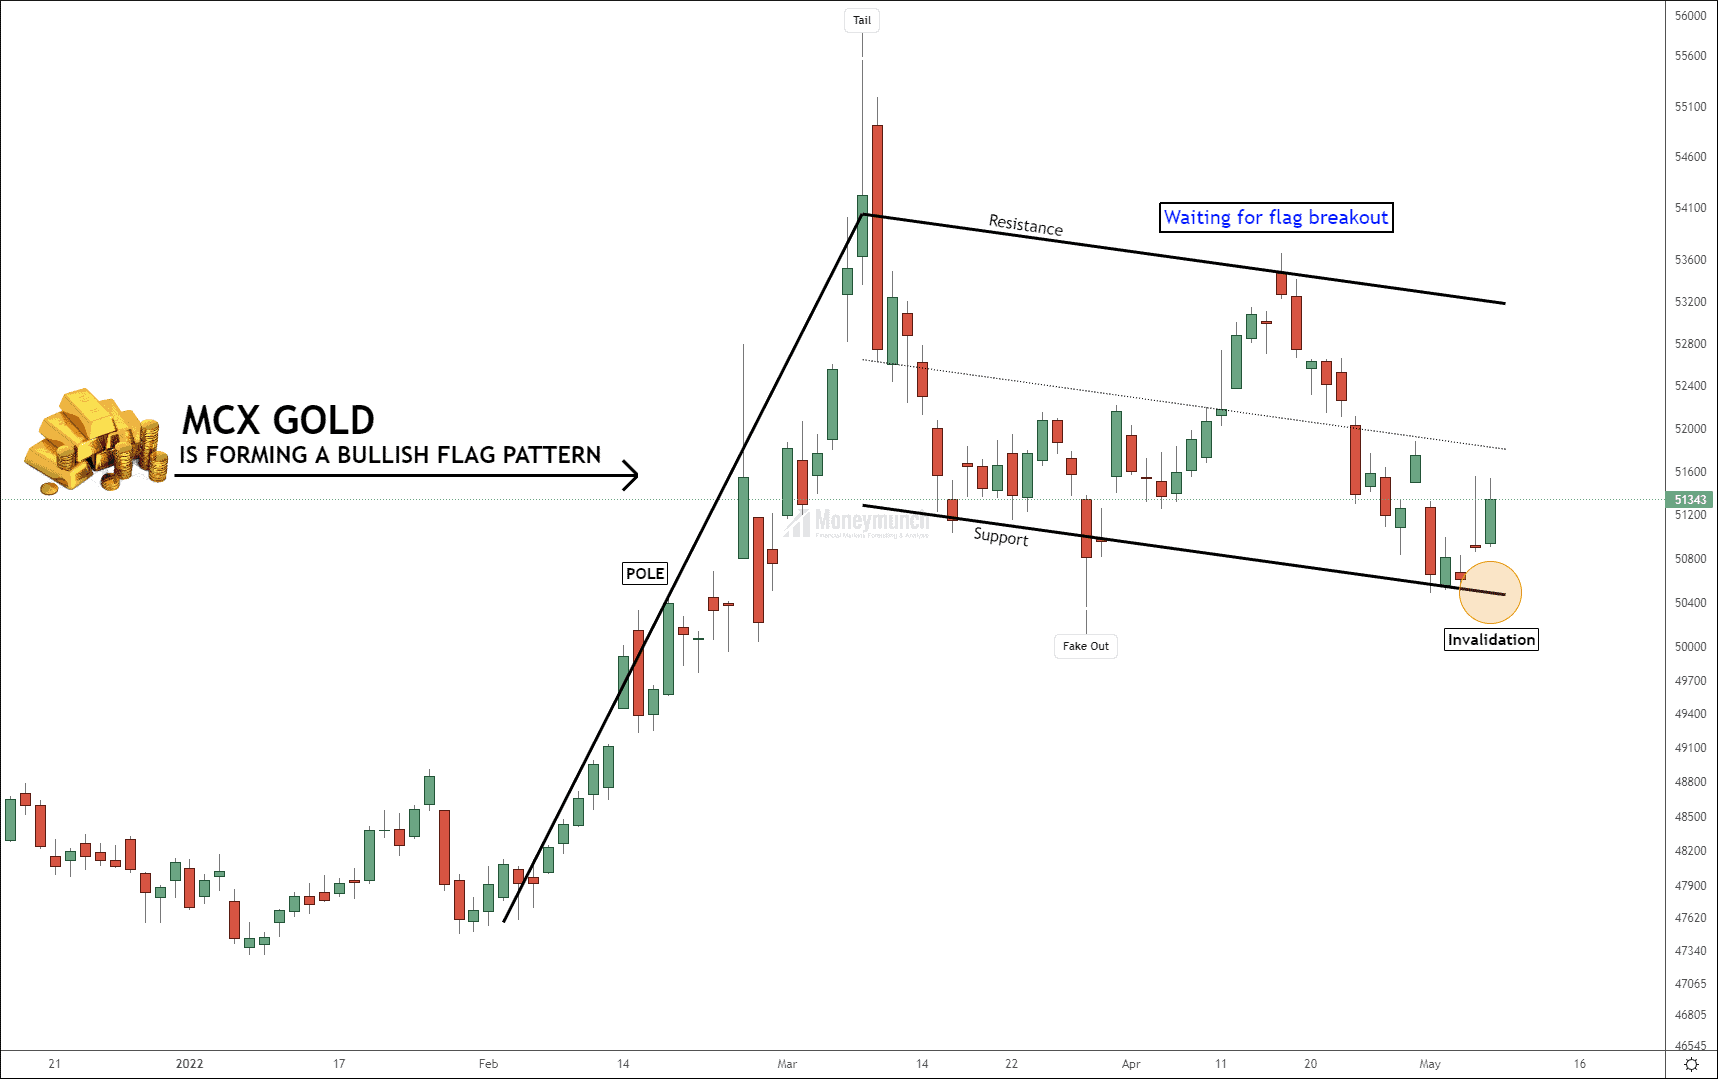
In the previous trading session, MCX Gold made a high of 51538 and closed at 51343 (+444). A question is, is it moving upward?

To identify uptrend:

There are two hurdles to continuing the uptrend. It should break out the 5th May high or settle above the control line.

According to the above chart, Gold is forming a bullish flag pattern. And we’re waiting for a breakout of the flag pattern. This breakout will skyrocket the gold price, and we can see 6400+ points of bullish movement here. Long-term target for gold 58000 – 60000.

Gold downtrend confirmation:


But if gold breaks the support trendline (invalidation), then a downtrend may start. And if it happens, I will update you asap.

At present, intraday traders can keep buying for targets of 51500 – 51800+ levels.

Watch significant releases or events that may affect the movement of gold, silver, and crude oil.

Monday, May 09, 2022
04:30 FOMC Member Bostic Speaks – Medium Impact
11:00 Investing.com Gold Index – Medium Impact
18:15 FOMC Member Bostic Speaks – Medium Impact

Tuesday, May 10, 2022
17:10 FOMC Member Williams Speaks – Medium Impact
18:00 FOMC Member Bostic Speaks – Medium Impact
21:30 EIA Short-Term Energy Outlook – High Impact

Wednesday, May 11, 2022
00:30 FOMC Member Mester Speaks – Medium Impact
02:00 API Weekly Crude Oil Stock – Medium Impact
04:30 FOMC Member Bostic Speaks – Medium Impact
18:00 Core CPI (MoM) (Apr) – Medium Impact
20:00 Crude Oil Inventories – High Impact
22:31 10-Year Note Auction – Low Impact
23:30 Federal Budget Balance (Apr) – Low Impact

Thursday, May 12, 2022
10:30 Natural Gas Storage – Low Impact
13:30 IEA Monthly Report – Medium Impact

Friday, May 13, 2022
08:30 Import/Export Price Index (MoM) – Low Impact
11:00 FOMC Member Kashkari – Medium Impact
12:00 FOMC Member Mester Speaks – Medium Impact
13:00 U.S. Baker Hughes Oil Rig Count – Medium Impact

The post Gold Price Predictions for 2022 appeared first on Moneymunch.

Can BankNifty Retest 32600 Again?

Posted: 08 May 2022 12:33 AM PDT

Free nse stock index banknifty chart calls

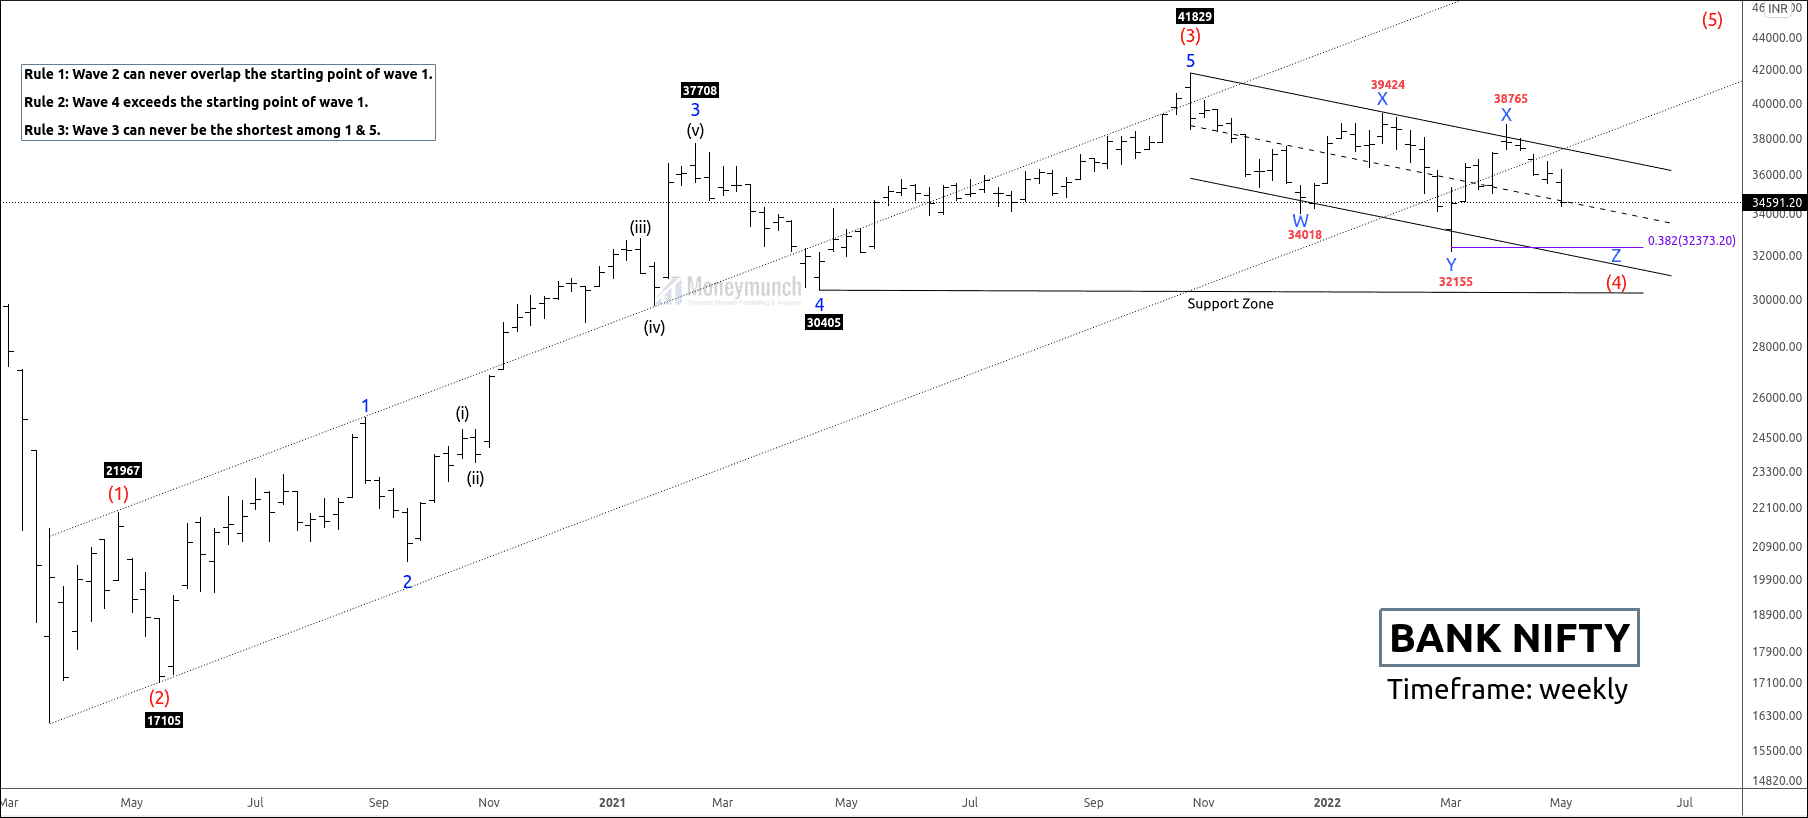
BankNifty Is Unfolding Final Impulsive Wave Z

Bank Nifty has started its Elliott wave cycle from the extreme low of 16116. It has completed the extensive impulsive wave (3) at 41829 and started falling in descending channel.

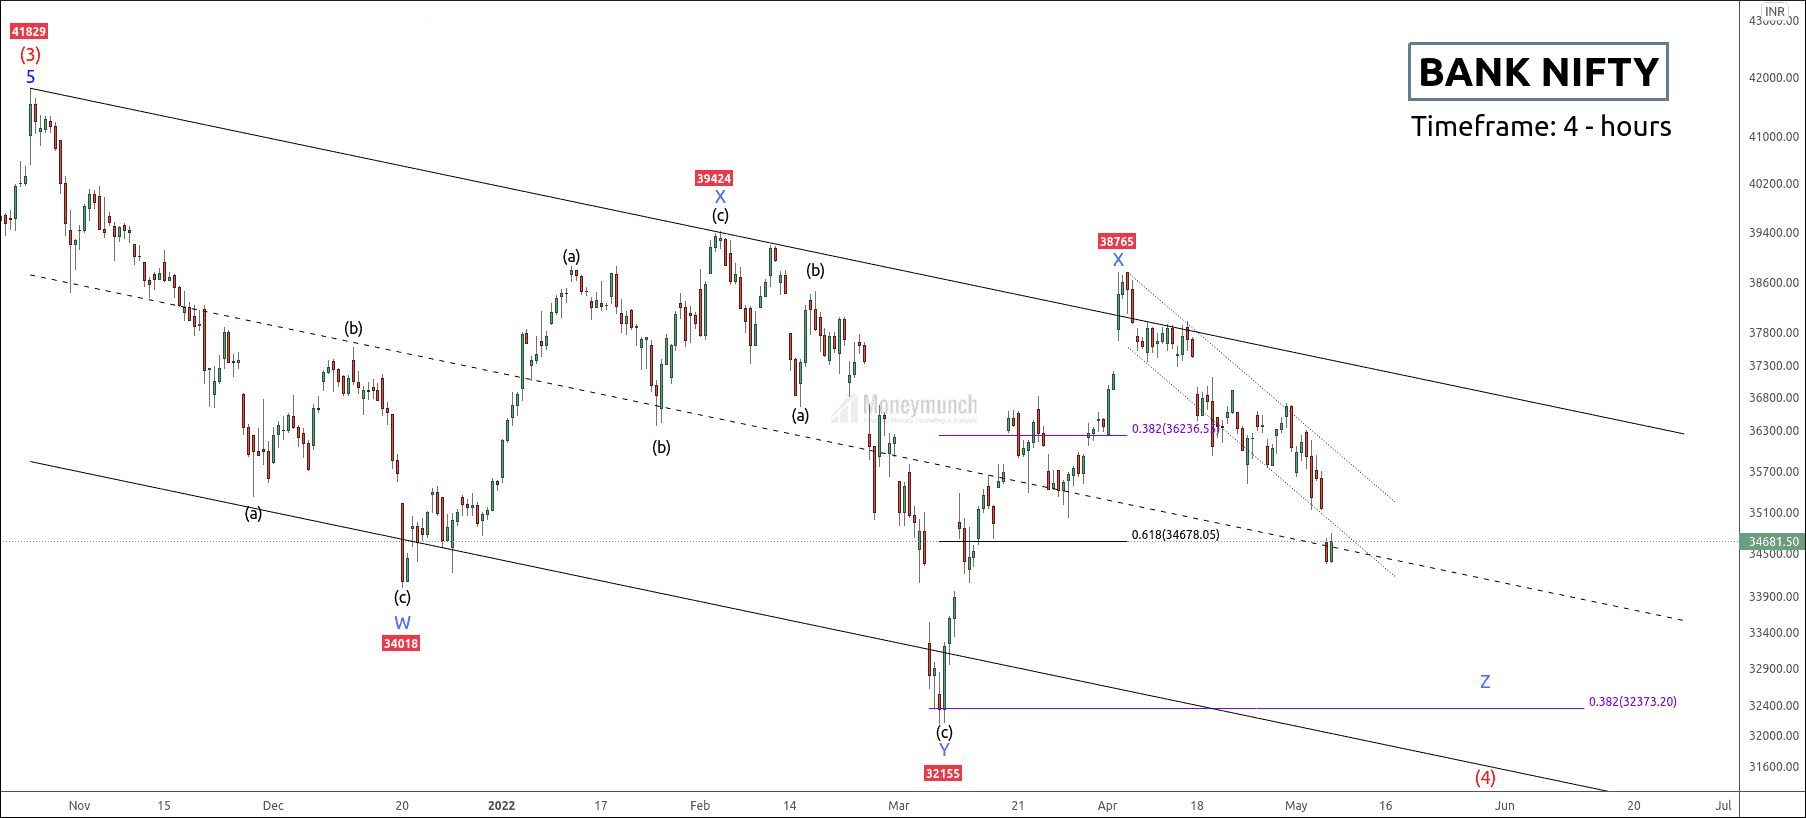
Currently, Banknifty is forming a triple zigzag on the corrective wave (4). Price has occurred the X-2 wave and started wave Z of the triple zigzag.

According to EWT, corrective waves move in the parallel channel, and the impulsive wave breaks the channel. An uptrend can only be possible after the breakout of wave X.

Let’s zoom into the lower timeframe to study this corrective structure:

Free nse stock index banknifty 4hours chart calls

Price is forming a final leg down Z. If the price breaks the control line, traders can short for the following target levels: 34115 – 33597 – 32613.

But the price has reversed seven times on the control line. If the price sustains above the control line with strong candles, the traders can long the following targets: 35168 – 36689 – 37517.

Although the wave principle has shown a bearish structure, we should always respect the price action.

Day traders should wait for our “morning outlook” for intraday trading on nifty and banknifty futures & options.

Only premium subscribers will get an options trade setup with a perfect strike price at the exact time.

Would you like to get our share market updates instantly?
Click the link to join: Free Stock Tips

Do you want to get premium NSE calls?
Click the link to subscribe: Premium NSE Stock Tips

If you have any questions or concerns about the stock market, don't hesitate to contact me:

Have you any questions/feedback about this article? Please leave your queries in the comment box for answers.

The post Can BankNifty Retest 32600 Again? appeared first on Moneymunch.