| Week ending September 15, 2017 |
Commodity markets continue to rally, while supply disruptions caused chemical prices to shoot up.
|
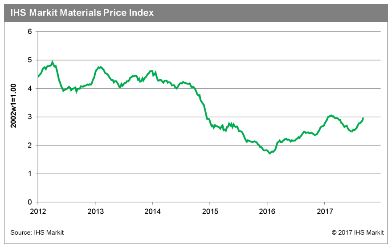
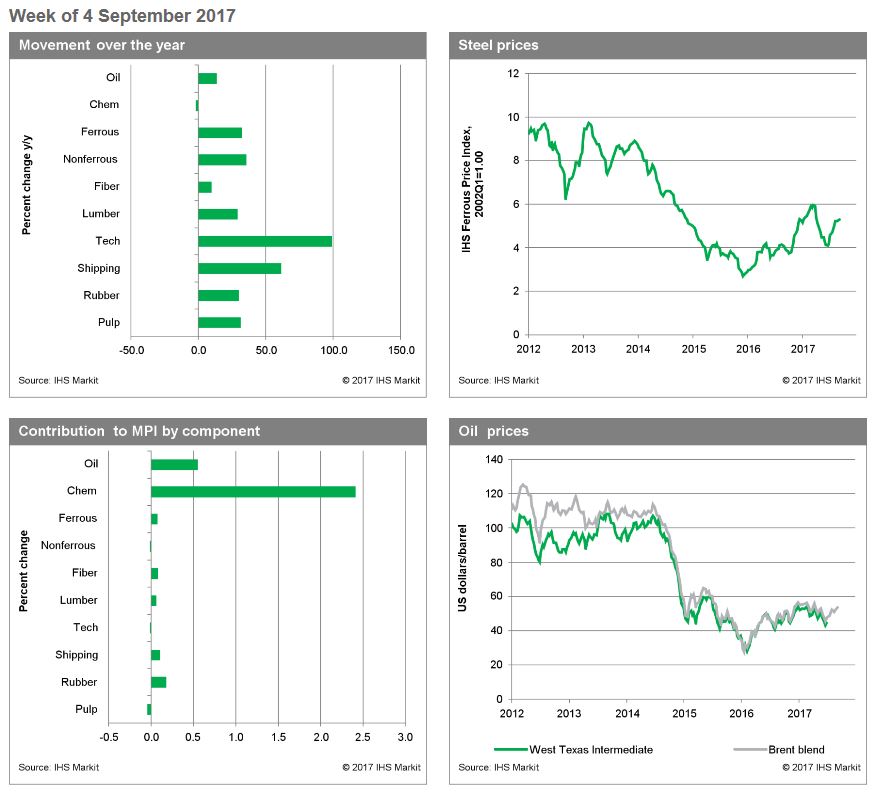
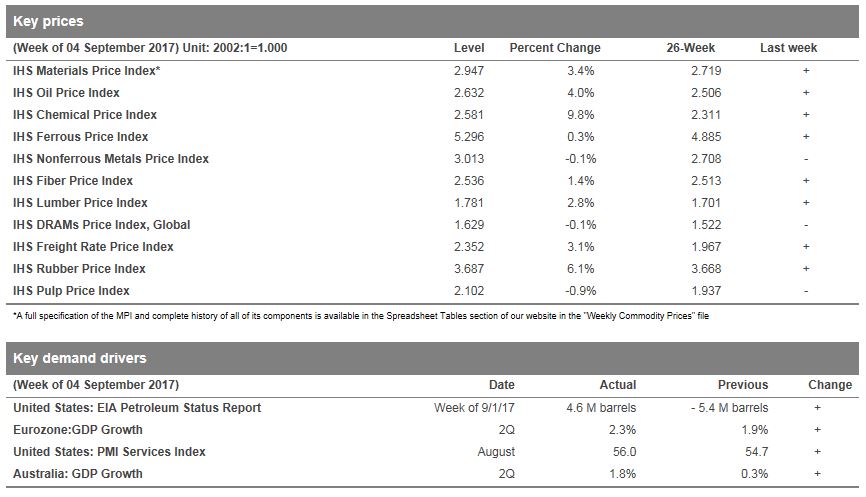
The Materials Price Index (MPI) increased 3.4% last week, continuing its rally as markets in North America recovered from Hurricane Harvey. The MPI’s increase was once again broadly based, with eight of the index's ten subcomponents increasing. Chemical prices were the driving force behind the MPI's jump, surging 9.8% as refining capacity remained offline in Texas. Absent the spike in chemical prices, the MPI would have risen 0.7%. On a technical note, the chemical prices sampled in the MPI come exclusively from the United States. While the size of the US industry is significant, the concentration of price quotes in North America does overstate the global impact on supply chains. A broader regional mix of chemical prices, along with expanded covered of energy markets to include regional coal prices, will be introduced into the MPI in the near future.
While chemical price increases have been sizeable, refinery capacity on the US Gulf Coast is already coming back into production. Producers are expected to bring at least half of the shut-down capacity back online by the end of this week. In addition, additional new capacity previously scheduled to begin operation in the fourth quarter is still slated to ramp up in the months ahead. The combination of returning and new capacity should slowly reverse the recent spike in chemical prices.
Apart from weather-related impacts, positive economic reports continue to support commodity markets. The August US PMI Services Index posted a very strong 56.0 reading, up 1.3 points from July—this is the highest result since last November. Second-quarter GDP growth in the Eurozone was revised up to 2.3% y/y (year on year)—this marks the fastest growth in the Eurozone in five years. Inflation remained stable in the Eurozone as well, increasing by 2% y/y in July. GDP growth was also revised up in Australia, increasing to 1.8% y/y, as consumer spending accelerated faster than expected. The optimism that has carried the market in the third quarter remains, although we maintain our view that upside risk is limited in the near term.
|
|
|
| | IHS Materials Price Index |  |
|
| | 
| Market Insight
For an overview of the IHS Materials Price Index, view this video.
Get the Materials Price Index delivered to your in-box weekly.
Subscribe here.
|
|  |
| | |
|
| Industrial Materials: Prices |  |
| Key Prices & Demand Drivers |  |
Construction Costs Rise for 10th Consecutive Month
|
Construction costs rose again in August, according to IHS Markit and the Procurement Executives Group (PEG).
|
The headline IHS Markit PEG Engineering and Construction Cost Index registered 54.0, up from 51.3 in July. Both material/equipment and labor sub-indexes registered rising prices.
The materials/equipment price index registered 54.2 in August, slightly higher than the July figure of 52.4. Price increases were uneven. Copper-based wire and cable increased once again, approaching the index figures last seen at the beginning of 2017.
“Commodity prices have risen strongly in the past seven weeks, with copper on the London Metal Exchange, jumping 14 percent between early June and August,” said John Mothersole, director Pricing and Purchasing, IHS Markit. “Better data from China, a softer U.S. dollar and new fears about mine supply disruptions have combined to lift prices. The market, however, looks overbought. If possible, we would avoid purchases at the moment and await what we believe will be a modest correction.”
| | Learn More |
|
| About IHS Pricing & Purchasing | | The IHS Pricing & Purchasing Service | The IHS Pricing & Purchasing Service enables supply chain cost savings by providing timely, accurate price forecasts and cost analysis. Armed with a better understanding of suppliers' cost structures and market dynamics, organizations can effectively negotiate prices, strategically time buys, and boost the bottom line.
With a database of more than 80,000 historic prices and thousands of price, wage and input cost forecasts, IHS offers more coverage than any other provider in the market. IHS has been providing forecasts of key commodity, labor, and input costs since 1970 -- helping define the purchasing advice industry. | | Learn More |
|
| Commodity Price Forecasts & Supply Chain Cost Benchmarking. Learn More | | |
|
|
|
