 |
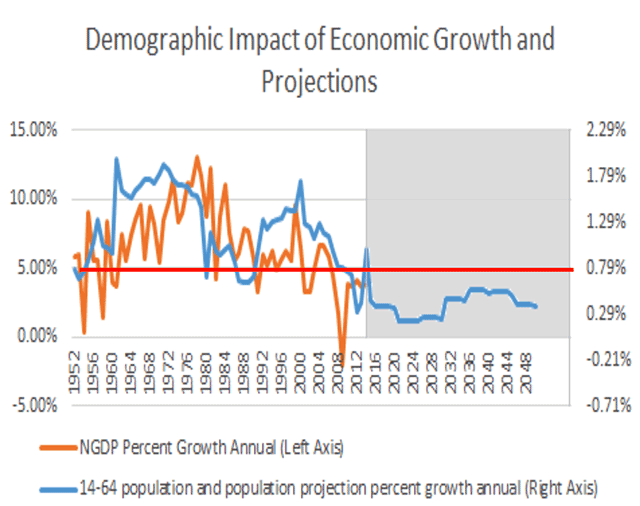
| Dear Reader, Over the course of this week, we will be sharing key insights from the 2017 Strategic Investment Conference exclusively with Mauldin Economics readers. A topic covered by speakers like Mark Yusko, David Rosenberg, Dr. Lacy Hunt, and Raoul Pal at the SIC was US economic growth and the reasons it will stay low for decades to come. Demographics Are Destiny Dr. Lacy Hunt, former senior economist at the Federal Reserve and EVP of Hoisington Investment Management, said the single best economic indicator is nominal GDP growth as it measures all the changes in market prices that have occurred during a given year. And this indicator suggests the US is in trouble. Despite a surge in optimism post-election, nominal GDP growth in 2016 was just 2.95%—making it the fifth worst year on record since 1948. What does this have to do with demographics? Mark Yusko, founder and CIO of Morgan Creek Capital Management told us...
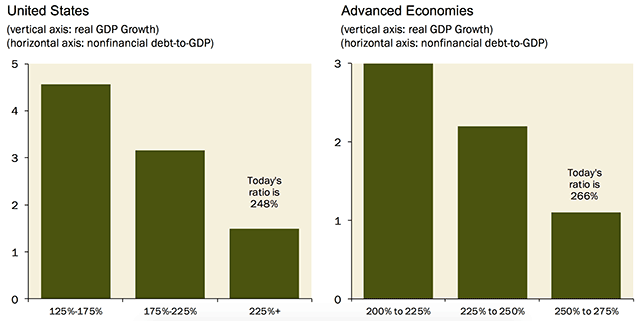
And the future looks bleak. According to the CDC, the fertility rate is at its lowest level since records began in 1909. This, coupled with the fact that 10,000 people turn 65 each and every day in the US, means growth in the working-age population will remain at record lows... thus weighing on any economic expansion. More Debt, Less Growth David Rosenberg, chief economist and strategist at Gluskin Sheff, dissected another trend hurting growth: DEBT. As these statistics from the Bank for International Settlements and Haver Analytics show, higher debt levels coincide with lower growth.
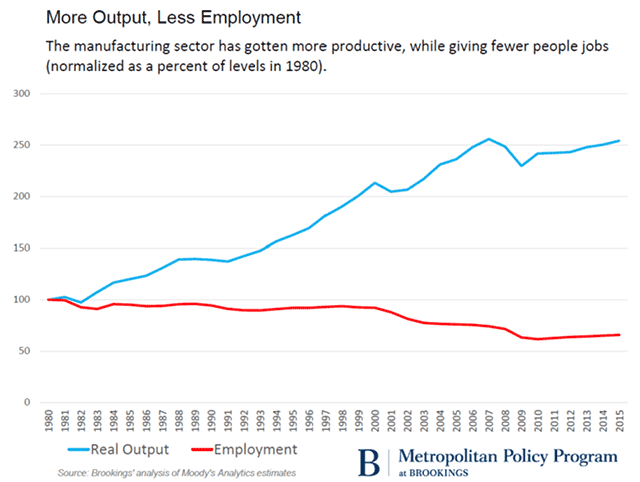
While the total debt/GDP ratio is 248% today, the non-partisan Congressional Budget Office projects it will rise to 280% by 2027... and that’s assuming nominal GDP grows at 4% per annum. This huge debt burden also means interest rates must stay low to keep service costs down... Dr. Lacy Hunt pointed out that a 1% increase in interest rates would mean an extra $200 billion in Federal debt repayments per annum. Devices Equal Lower Prices Another deflationary trend discussed at the SIC 2017 is the rise of automation and technology. Findings from the Brookings Institute show rising productivity in manufacturing has led to a decline in employment in the sector.
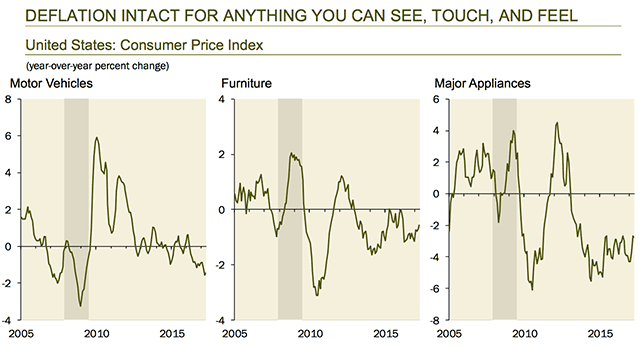
By removing labor costs, automation is driving down the price of core goods, as David Rosenberg detailed.
But no longer is this just in manufacturing. In a recent study, PriceWaterhouseCooper found that 38% of US jobs will be automated by 2030, which means more deflationary pressures. And these pressures have serious implications for your portfolio... With US equities trading at all-time highs, should you invest in them with little chance of earnings growth?... With inflation likely to remain low, are Treasuries a buy at 2.2?  Remember, your SIC 2017 Virtual Pass includes: audio of every presentation, panel, and the always popular on-stage discussions at the SIC from 26 expert speakers, slide presentations loaded with investment ideas, transcripts of every session, and a special SIC 2017 highlights video—all in a simple hassle-free format. You can get your virtual ticket to 2017’s premier investment conference until June 9 for just $450. Thank you for your continued support of Mauldin Economics. Sincerely,
|
| Copyright © 2017 Mauldin Economics. All Rights Reserved |


