
Supply Bottlenecks and the Crazy Pattern of Inventories: Implications and Outlook
Link to PDF: Supply Bottlenecks and the Crazy Pattern of Inventories: Implications and Outlook
*In current dollar terms, inventories have jumped at the manufacturing and wholesale levels as businesses have been forced by supply chain disruptions to hold more inventories of components and goods in progress and ready for sale. But the prices of those inventories have risen dramatically, resulting in declines of real inventories in inflation-adjusted terms.
*Retail inventories have fallen, as strong product demand has overwhelmed goods available for sale. However, the decline in retail inventories has been attributable virtually entirely to the fall in inventories of motor vehicles and parts, reflecting supply bottlenecks stemming primarily from shortages of computer chips, while other retail inventories have risen.
*While final sales have driven the recovery, the dramatic liquidation of inventories has reduced GDP. The easing of supply bottlenecks will add significantly to GDP as businesses ramp up production to meet product demand and replenish inventories.
Inventories: Differing patterns among Manufacturing, Wholesale Trade and Retail Trade
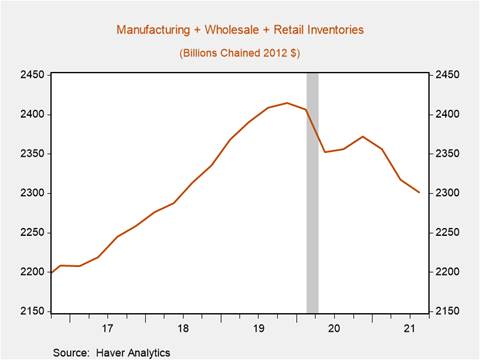
Manufacturing and wholesale inventories have risen in nominal terms but fallen in real terms, reflecting soaring inflation of the buildup of inventories of commodities, materials, component parts on hand, and ready-to-ship products. In contrast, retail inventories have plummeted in both nominal and real terms from their levels prior to the pandemic, as production constraints related to pandemic induced shutdowns and subsequently as the strong rebound in product demand has eaten into the stock of private inventories. Combined, real inventories at the manufacturing, wholesale and retail levels were 4.7% lower in Q3 2021 than in Q4 2019 (Chart 1).
Chart 1: Real Manufacturing, Wholesale Trade, and Retail Trade Inventories
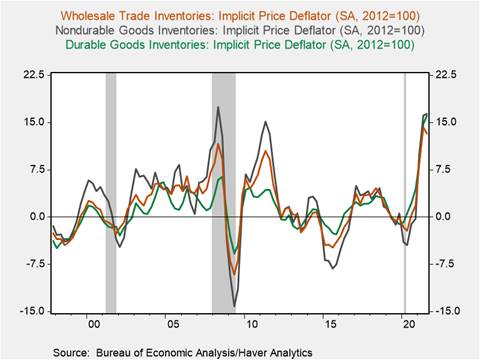
Manufacturing inventories, which include materials and supplies, work in progress, and finished/ready for sale goods, have risen, reflecting supply shortages that have disrupted production and generated bottlenecks in distribution. However, they have declined in real terms as soaring inflation of the inventories of materials and supplies has exceeded the rise in nominal inventories. The implicit price deflator for manufacturing inventories has spiked up 26% in the last year (24.6% for durable goods inventories and 28% for nondurable goods inventories, while the implicit deflator for wholesale inventories has risen 13.2%) (Chart 2). Consequently, real inventories have fallen 2.2% yr/yr in Q3 2021 and are 4.3% below their levels in Q4 2019. Real wholesale trade inventory growth has flattened over the course of the pandemic following robust growth in the aftermath of the Great Financial Crisis, falling from a peak of $845 billion in Q4 2019 to $833 billion in Q3 2021.
Chart 2: Private Inventories Implicit Price Deflators (yr/yr % change)
Real retail trade inventories plummeted from $699 billion in Q1 2020 to $621 billion in Q3 2021, an 11% decline, with the bulk of inventory liquidation concentrated among motor vehicle and parts dealers reflecting the turbulent supply chain backdrop that has beset auto manufacturers over the course of the pandemic (Chart 3). The implicit deflator for retail inventories has increased 8.0% yr/yr (12.6% for motor vehicles and parts and 6.4% for foods and beverages).
Chart 3: Real Retail Trade and Retail Motor Vehicle Dealers Inventories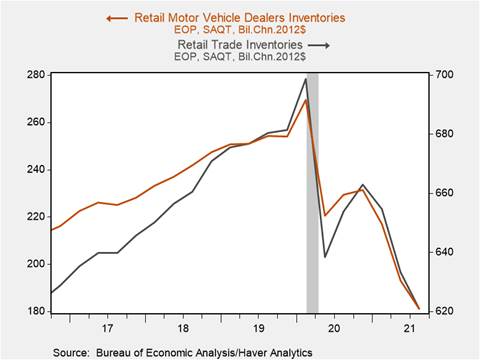
These patterns of inventories and their underlying sources have been associated with a spike in production costs. In addition to higher production costs stemming from supply shortages, our research has emphasized the sizable role of robust aggregate demand on inflation (Inflation Watch, October 22, 2021).
Durables vs. Nondurables
The decline in real private inventories has occurred exclusively in the durable goods sectors which have fallen 9.9% since Q1 2020, while nondurable goods inventories have risen 1.1% (Chart 4). This is consistent with the dramatic shift in consumption to durable goods over the course of the pandemic at the same time durable goods production was hit by a rolling wave of supply constraints: factories shut down in response to the COVID-19 pandemic, global ‘just-in-time’ supply chains were snarled, producers faced labor shortages, and distribution channels were clogged.
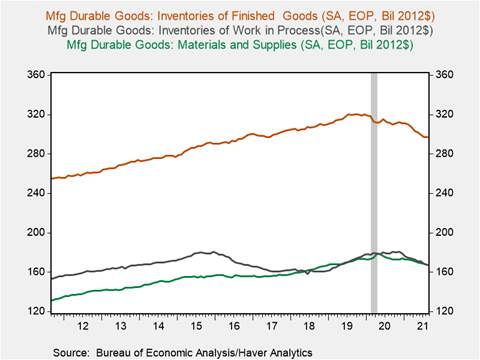
Real final sales of durable goods soared as production stalled in 2020-21, outpacing the production of durable goods by $84 billion annualized in Q3 2021 (Chart 5). This was reflected as inventory liquidation. Indeed, most of the declines in real manufacturing inventories between January-August 2021 have been concentrated in durables, for which materials and supplies (-$5.8 billion), work-in-process (-$10.8 billion), and finished goods (-$14.5 billion) (Chart 6).
The decline in real manufacturing inventories has been underpinned by steep falls in real inventories of primary metals, fabricated metal products, and machinery which fell by a combined $21 billion between January 2020 and August 2021. Not surprisingly, prices of these commodities and materials have soared. The S&P GSCI industrial metals index (which includes aluminum, copper, lead, nickel, and zinc) has increased 45% since early 2020. Real inventory to sales ratios have fallen below pre-pandemic levels for machinery and fabricated metal products, but risen above those levels for primary metals. This increase in the real inventory to sales ratio of primary metals likely reflects the decline in auto production.
Chart 4: Real Durable vs. Nondurable Goods Inventories
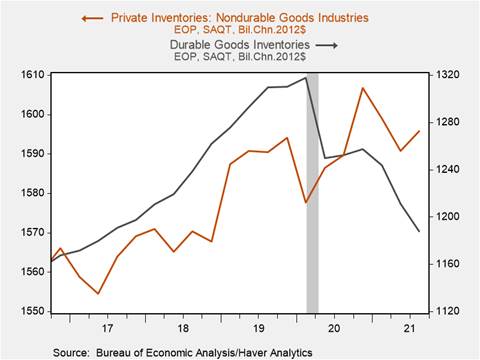
Chart 5: Real Final Sales of Durable Goods minus Real Durable Goods Production (SAAR)
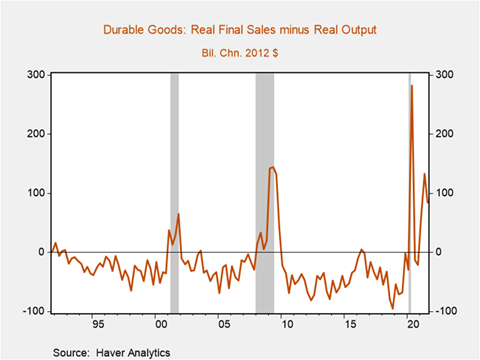
Chart 6: Manufacturing Inventories by Stage of Production
Autos
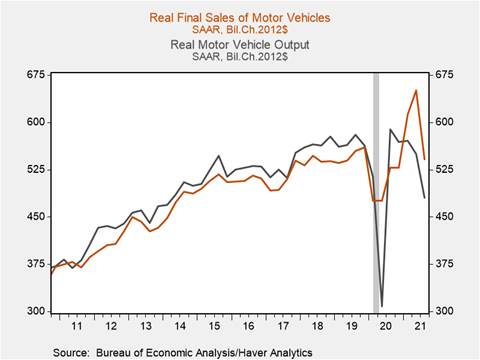
The production bottlenecks besetting the motor vehicle and parts inventories explain more than 100% of the dramatic decline in real retail trade inventories. Between January and August 2021, real inventories of motor vehicle and parts dealers’ fell $45 billion, while total retail trade inventories fell $37 billion. Shortages of semiconductors and other components that have crimped auto production amid strong demand for motor vehicles resulted in dramatic depletions of inventories at car dealerships. Real final sales of autos rose to $650 billion annualized, but real output fell to $550 billion – a $100 billion gap (Chart 7). Most of the inventory liquidation in the auto industry has occurred at the retail trade level, where real inventories are 27% below their January 2020 levels. Dealer inventories remain extremely low: the average number of days a car spends on a dealer’s lot is down to 1-2 weeks compared to its 45+ day historical average.
Given the magnitude of inventory liquidation in the auto sector, the pace of inventory replenishment and inventory investment’s contribution to economic growth will be determined in large part by the recovery of motor vehicle manufacturing. Industry leaders currently say that global supply constraints and increased availability of semiconductors will occur in the second half of 2022. We project continued strong demand for autos. When auto manufacturers ramp up production, pent up demand will allow inventories to rise only gradually.
The increased auto production will ease prices. The sharp increase in new vehicle prices throughout 2021 means any moderation in price increases of new vehicles will have a deflationary impact due to ‘base effects’. However, auto manufacturers are experiencing higher costs of inputs and production costs and will be slow to lower prices. The eventual rise in motor vehicle production will also contribute to easing prices of used autos. Despite these easing of price pressures, the broadening of price increases of most goods and services and ongoing aggressive monetary and fiscal stimulus point toward continued elevated inflation (Rising inflation: granular data analysis shows broadening dispersion of price increases).
Chart 7: Real Final Sales of Autos vs. Real Auto Production (SAAR)
Nonauto retail inventories have risen very modestly in real terms, although in some sectors they have not kept pace with strong demand. Inventories of clothes and apparel products have fallen sharply, while they have been relatively flat in food and beverages and have risen in furniture and building products.
At the manufacturing and wholesale trade levels, inventories of petroleum products and chemicals have risen, while they have fallen significantly in apparel.
Inventory Investment and Real GDP
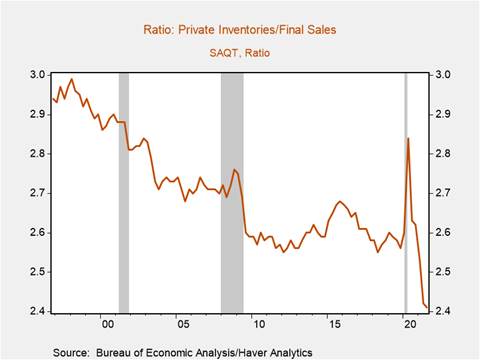
As supply chain bottlenecks are resolved and disruptions to distribution recede in 2022, production will expand to meet demand and inventories will be replenished. The ratio of real private inventories to final sales is at an all-time low of 2.4, compared to its pre-pandemic average of 2.6 (Chart 8), while the ratio of retail inventories-to-sales is 1.1, by far the lowest in history. Some businesses will look to build up larger buffer stocks of inventories in response to the supply dislocations associated with the pandemic in a tilt away from just-in-time supply chains.
GDP measures production, so a change in inventories affects GDP while the change in the change in inventories affects the change in GDP. Accordingly, measured on an annualized basis the $77.7 billion decline in inventories in Q3 2021 added 2.1 percentage points to real GDP growth because it was less than the $168.5 billion decline in Q2. But with the level of inventories severely depleted, inventory investment is poised to contribute significantly further to real GDP growth. In our base forecast, private inventory accumulation accelerates through Q3 2022, and real private inventories surpass their pre-pandemic levels by Q1 2024. We predict inventory building will contribute strongly to real GDP growth in H1 2022, adding approximately 1.2 percentage points to annualized GDP growth in Q1 and 1.0 in Q2.
A pickup in manufacturing production when shortages of select materials and components become available will be associated with a rise in employment and productivity. However, increased consumption when distribution bottlenecks dissipate will put an initial damper on inventory investment, and longer-term inventory trends such as the persistent decline in farm inventories may weigh on overall inventory investment.
Chart 8: Real Private Inventories to Final Sales Ratio
Broader issues in production, supply chains, and inventory management
The jarring impacts of the supply chain bottlenecks imposed by the pandemic, along with national security issues and local politics, raise large challenges for production and inventory strategies going forward. Just-in-time supply chains have increased global production efficiencies and reduced operating costs, but the pandemic highlights how they are very fragile and have proved to be insufficiently flexible to deal with jarring shifts in either product demand or supply shortages of critical commodities or materials. National security issues, particularly centering on heavy reliance on China, also influence business strategies.
Some businesses have indicated they intend to pivot away from highly globalized, ‘just-in-time’ supply chains, but they must first deal with current supply-demand imbalances before implementing new strategies on global supply chains, production, and inventory management. Moreover, while the adjustment of global supply chains may be relatively easy for production of some products, it is extremely costly and would take years for complex high-tech products. The implementation of any new strategy will take time to unfold, and in reality, the implications are unclear.
Following Japan’s massive earthquake and tsunami in 2011, global business leaders and policymakers pledged to address risky exposures in their global supply chains and improve risk management. In the subsequent 10 years, few changes have been implemented. In response to concerns about China’s unsavory trade practices, U.S. policymakers have pledged to reduce reliance on China. So far, strikingly few U.S. companies have done so. The reality is businesses do not want to jeopardize the benefits of China’s efficient and low-cost production processes and large market.
Businesses do focus on longer-run strategies, but most are under pressure to improve near-term outcomes. Political leaders focus primarily on the next election and longer-term strategic thinking is secondary.
Business inventory management is driven largely by actual and expected product demand. However, it is also influenced by the costs of financing inventories. Here, interest rates and inflation come into play. Presently, robust product demand and a favorable outlook raises businesses desire to hold more inventories. Extremely low interest rates—they are negative in real terms--reduce the costs of businesses to hold more inventories. The sharp increase in inflation of inventories on hand increase the incentive to hold more inventories. It pays for businesses to build inventories.
These near-term factors are expected to dominate longer-run strategic changes in supply chain and inventory management.
Mickey Levy, mickey.levy@berenberg-us.com
Mahmoud Abu Ghzalah, mahmoud.abughzalah@berenberg-us.com
© 2021 Berenberg Capital Markets, LLC, Member FINRA and SPIC
Remarks regarding foreign investors. The preparation of this document is subject to regulation by US law. The distribution of this document in other jurisdictions may be restricted by law, and persons, into whose possession this document comes, should inform themselves about, and observe, any such restrictions. United Kingdom This document is meant exclusively for institutional investors and market professionals, but not for private customers. It is not for distribution to or the use of private investors or private customers. Copyright BCM is a wholly owned subsidiary of Joh. Berenberg, Gossler & Co. KG (“Berenberg Bank”). BCM reserves all the rights in this document. No part of the document or its content may be rewritten, copied, photocopied or duplicated in any form by any means or redistributed without the BCM’s prior written consent. Berenberg Bank may distribute this commentary on a third party basis to its customers.