|
To investors,
The last three years of financial markets have been chaotic. Uncertainty and a lack of predictability ruled the day. It highlighted the difficulty of investing and humbled investors across different asset classes.
There is a tendency in the investment game to always look forward. People don’t like to look back, evaluate what went right or wrong, or dissect which decisions were erroneous. I spent a few hours this morning doing exactly this though — I wanted to see which assets performed best over the last three years. Were the public narratives correct? What were the hidden gems? Which strategies were completely off-base? Here is what I found…
First, the methodology that I used was to start the analysis from January 1, 2020 till today. You can always pick a random timeline to fit within a narrative, but I felt this was the best start date to highlight the pre-pandemic prices of various assets.
We can start with the major US stock indexes. The S&P 500 is up approximately 24% and the Nasdaq 100 is up 38.5% in the almost 38 month period. If we look internationally, the MSCI Emerging Markets Index is down nearly 13%. If we remove the emerging markets and look at the MSCI World Index, it has appreciated nearly 15% in the same time frame.
The conclusion of the basic equity indexes is that we had long periods of appreciation and drawdowns over the three years, but developed nations out performed emerging markets and the US outperformed the world. Many of these indexes, including the S&P 500 and the Nasdaq 100, performed generally in-line with their historical annual return profile.
In the bond markets, we see the S&P 500 Bond Index is down 6% since Jan 1, 2020. The Vanguard Total Bond Market Index is down about 18%. The S&P Global Developed Sovereign Bond Index is also down around 10%.
It doesn’t take a rocket scientist to understand that the bond market has been obliterated in the last 12 months and the total return on these assets for the 3-year period is negative.
The real estate market generally has not done much better. The Dow Jones U.S. Real Estate Index is down 8% since the start of 2020 and the Green Street Commercial Property Price Index is essentially flat during the same time period. We can also look at the MSCI World Real Estate Index, which consists of various equities in the real estate sector globally, and see that the three year performance is under 1% appreciation as well.
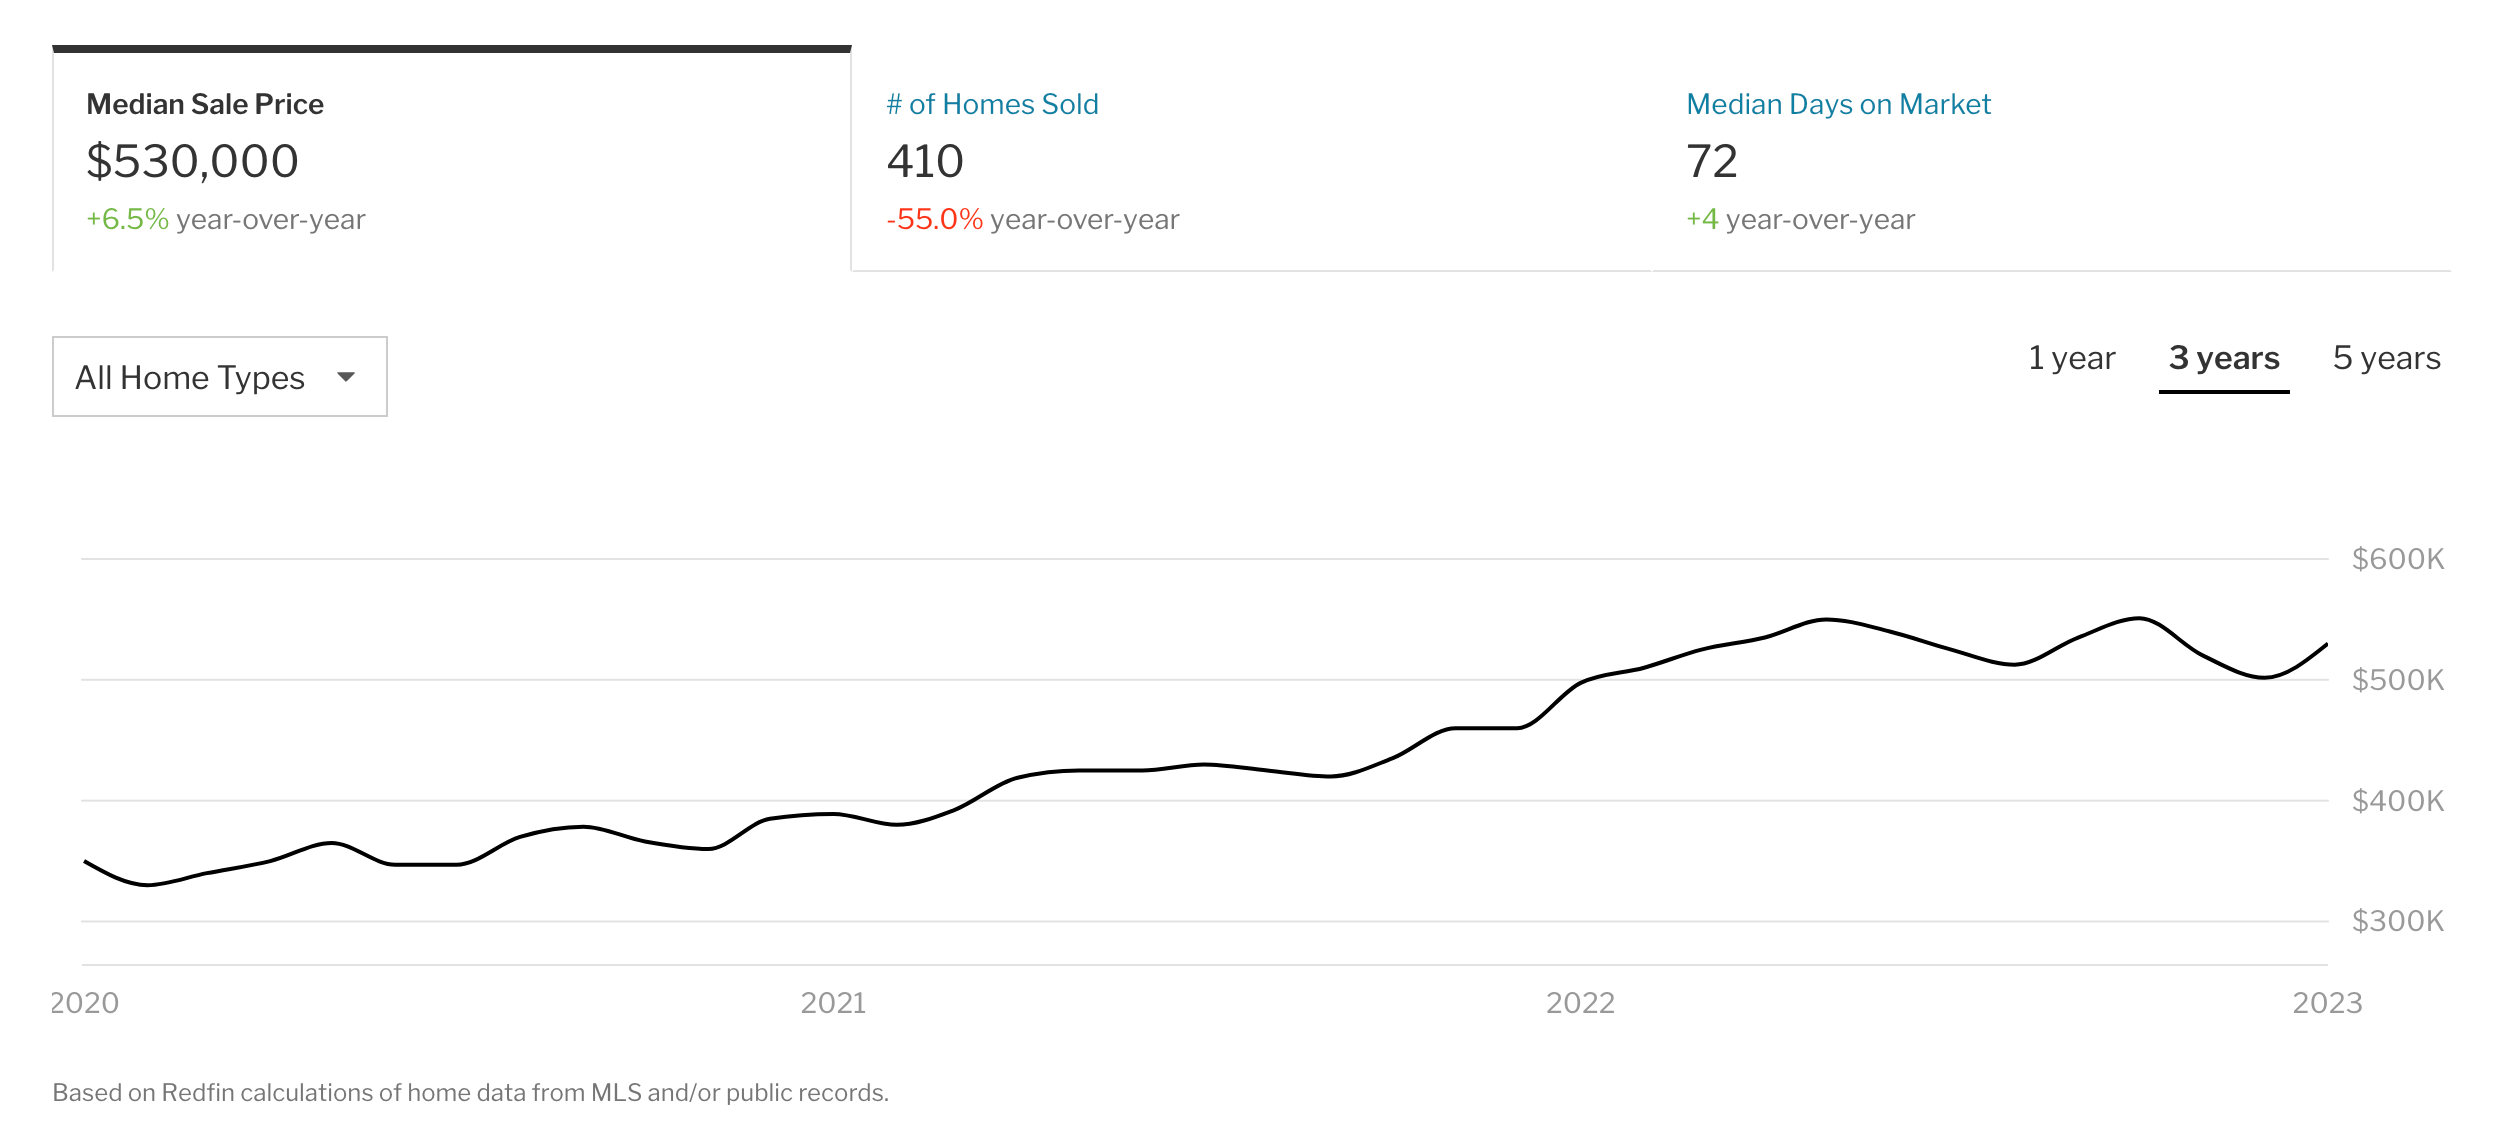
These broad-based indexes don’t tell the full real estate story though. For example, Miami real estate is up over 50% since January 2020.
On the other hand, San Francisco median sale price is down about 7%. Geography mattered over the last three years for real estate, especially when you account domestically for the dramatic moves from California and New York to Florida and Texas.
The conclusion on real estate is that it didn’t actually perform nearly as well as you would have expected during a high-inflation environment. The big run up in prices has essentially been given back in many markets due to the aggressive monetary tightening from the Federal Reserve.
But let’s push further into this analysis…
🚨 The rest of this letter is only available for paying subscribers to The Pomp Letter. Their support makes this work possible. If you’re not a subscriber, consider subscribing to read the rest of this letter and help us continue to create independent work on financial markets 🚨...
Subscribe to The Pomp Letter to read the rest.
Become a paying subscriber of The Pomp Letter to get access to this post and other subscriber-only content.
A subscription gets you:
| Five subscriber-only letters per week and full archive | |
| Subscriber-only episodes in your podcast app | |
| Post comments and join the community |


