Jump in headline and core CPI ... is there relief ahead?
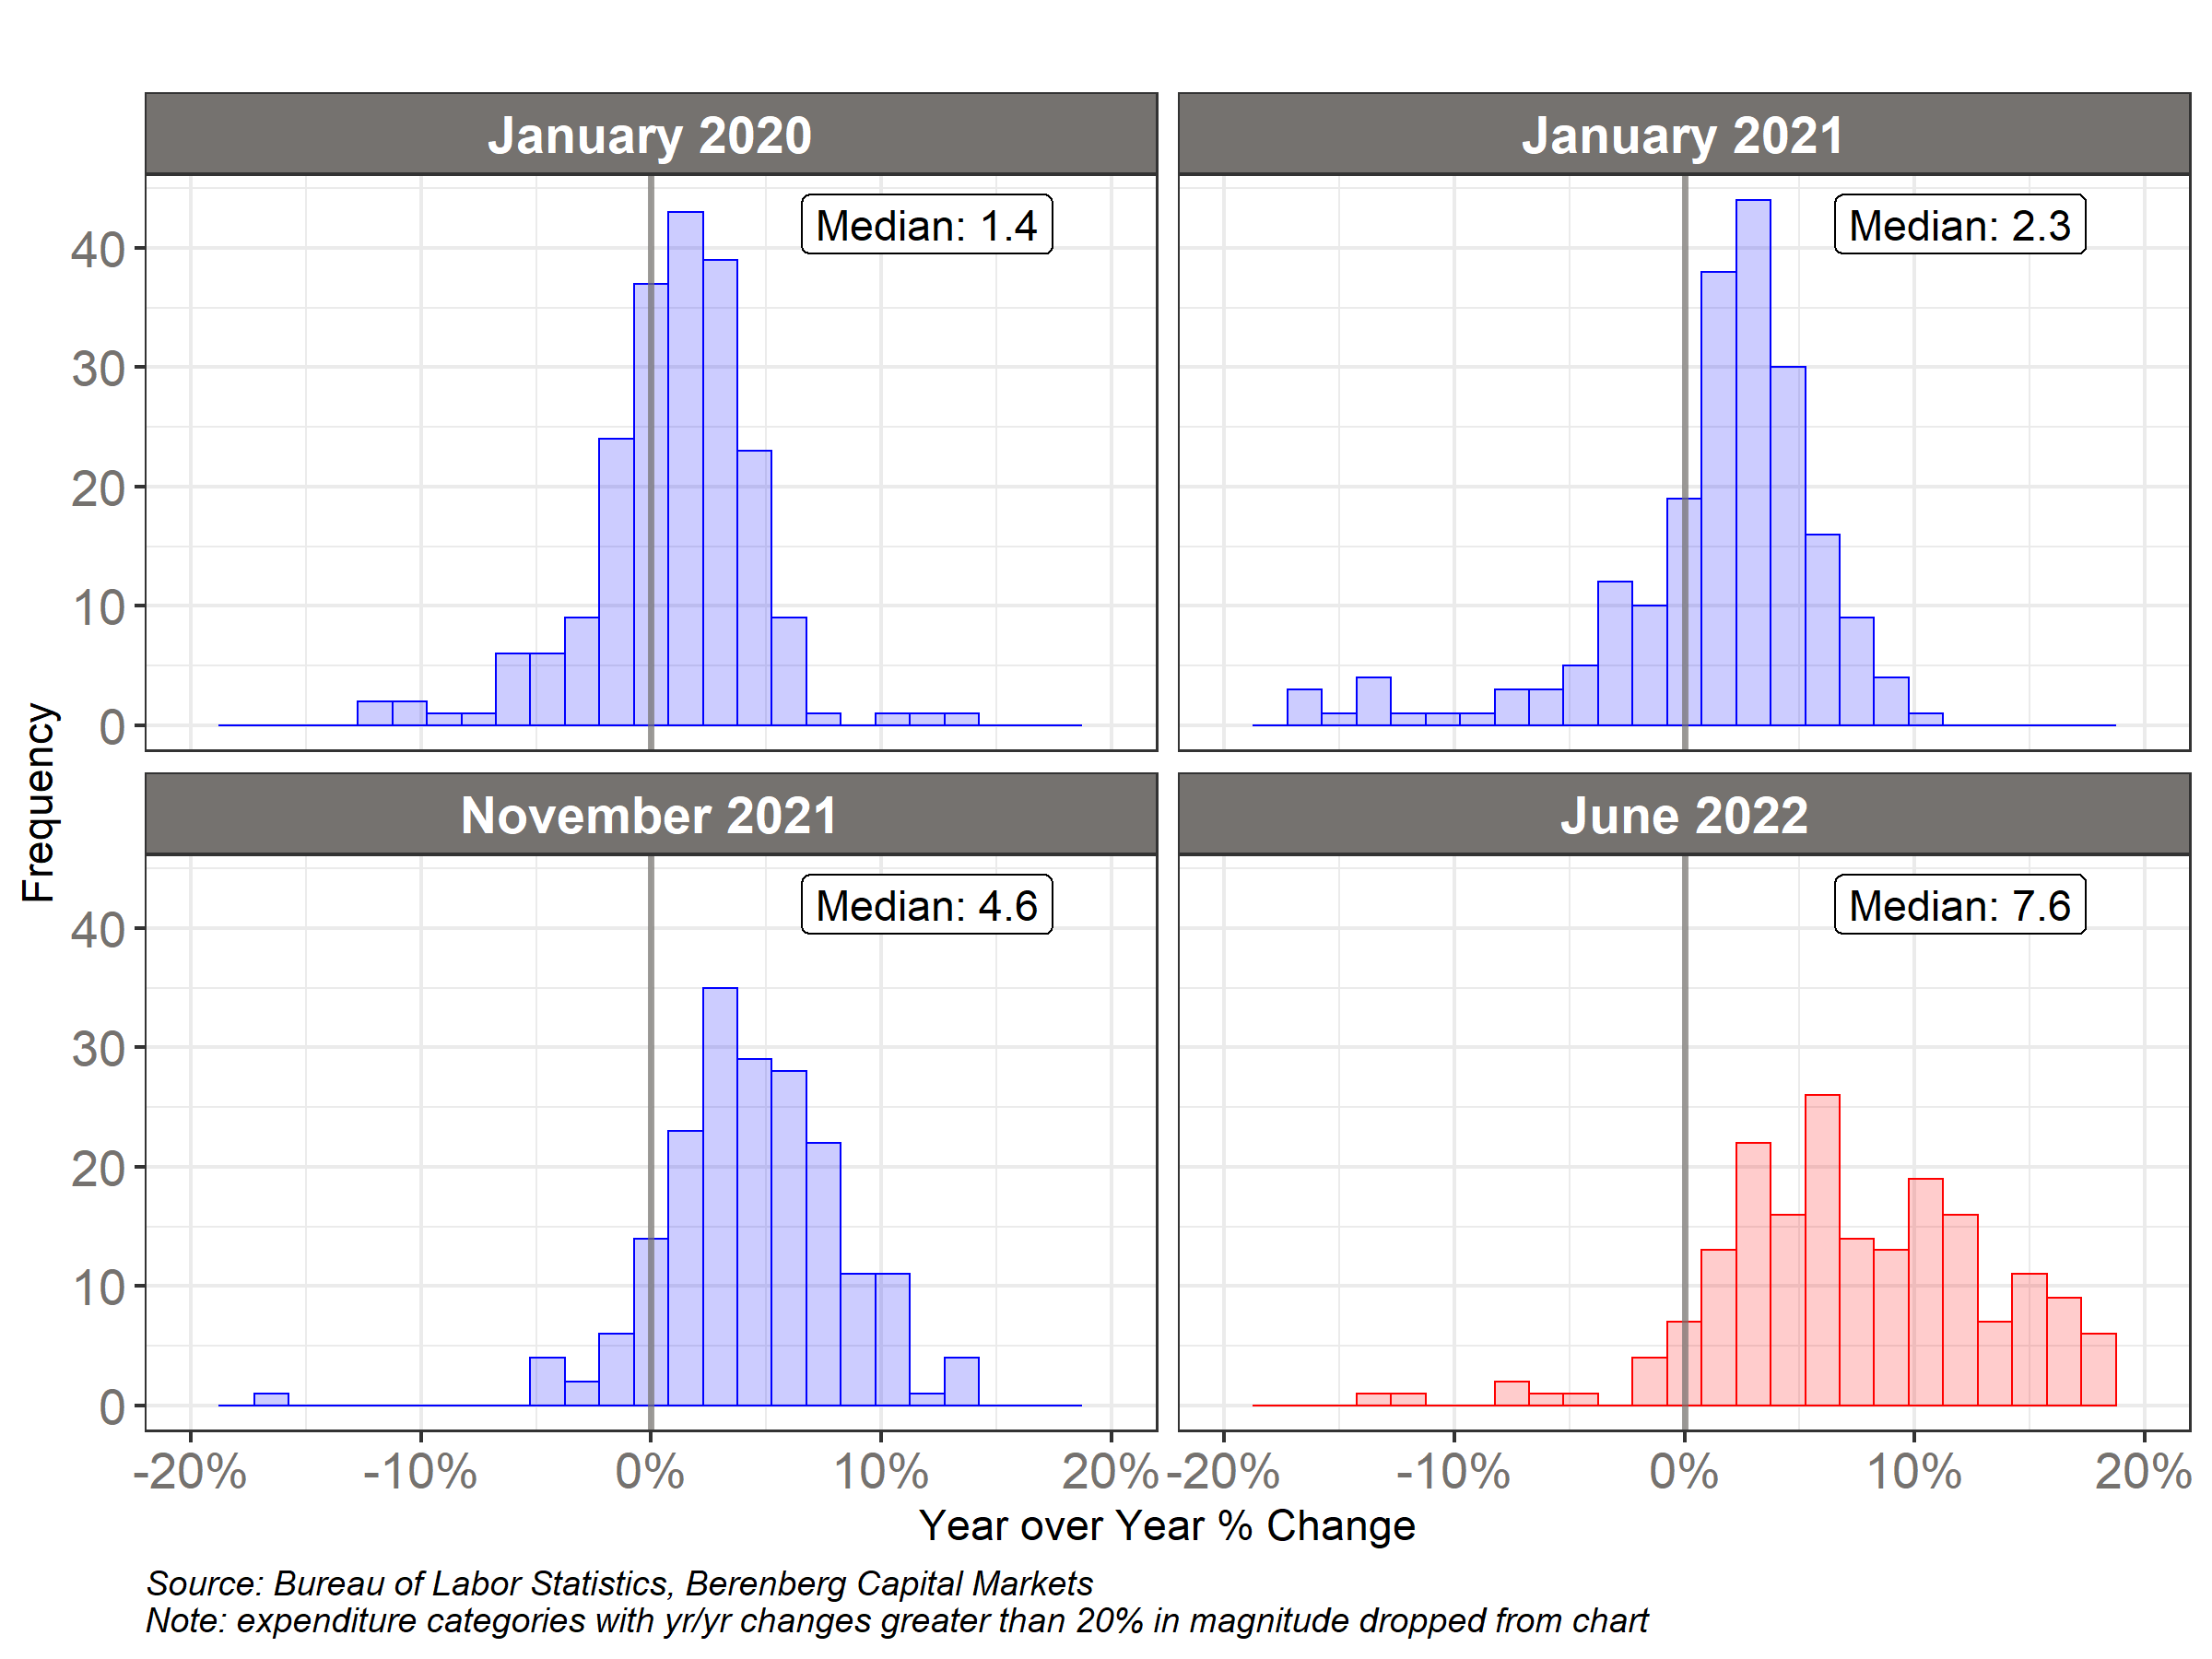
*The headline consumer price index surged 1.3% m/m in June, lifting the yr/yr increase to a blistering 9.1% yr/yr (Chart 1). While the bulk of the June acceleration in m/m inflation reflects a transient spike in energy prices, which contributed 0.6pp to monthly inflation, the continued broadening of inflationary pressures is cause for concern (Chart 2). Core CPI inflation (excluding food and energy) re-accelerated, rising 0.7% on a m/m basis. Core inflation gathered momentum in Q2 rising 7.9% on a 3-month annualized basis and is far too high for the Fedâs comfort. Chair Powell has indicated the Fed will debate between a 50 or 75bp policy rate increase at their meeting later this month, and todayâs CPI report significantly bolsters the odds of the latter option.
*A spike in national average gasoline prices, which increased 10% through June and briefly topped $5+ per gallon was a key driver of the acceleration in headline inflation, and energy prices in the CPI increased a robust 7.5% m/m and 41.6% yr/yr (Chart 3). However, this inflationary impulse has already begun to fade, with gasoline prices retracing a significant portion of their June rise. Average gasoline prices have fallen 40 cents to $4.60 per gallon, and sharp declines in wholesale gasoline prices will feed into further declines in prices at the pump, albeit with a lag and should slow sequential monthly momentum in headline inflation.
*Goods prices continued to increase at a rapid clip in June, underscored by sustained increases in both new and used vehicle prices which rose 0.7% and 1.6%, respectively. While continued constraints on production and low dealer inventories may support continued growth in new vehicle prices in coming months, private sector data suggests used vehicle prices have likely reached an inflection point. Manheimâs Used Vehicle Value Index declined 1.3% in June and higher frequency used car market data points to a decided slowing in activity which should weigh on further price increases going forward and ease some core inflation pressures.
*Price increases across goods categories were relatively broad based, with prices of household furnishings and supplies (0.5% m/m), appliances (0.2% m/m), and recreation commodities (0.4% m/m) all increasing over the month. However, there is reason to believe price increases may moderate in the near term. The rotation in consumer spending away from durable goods and toward services, paired with slowing housing market activity, will weigh on price gains, while inventory building among major big box retailers has prompted price cuts and sales across a range of overstocked consumer durable goods.
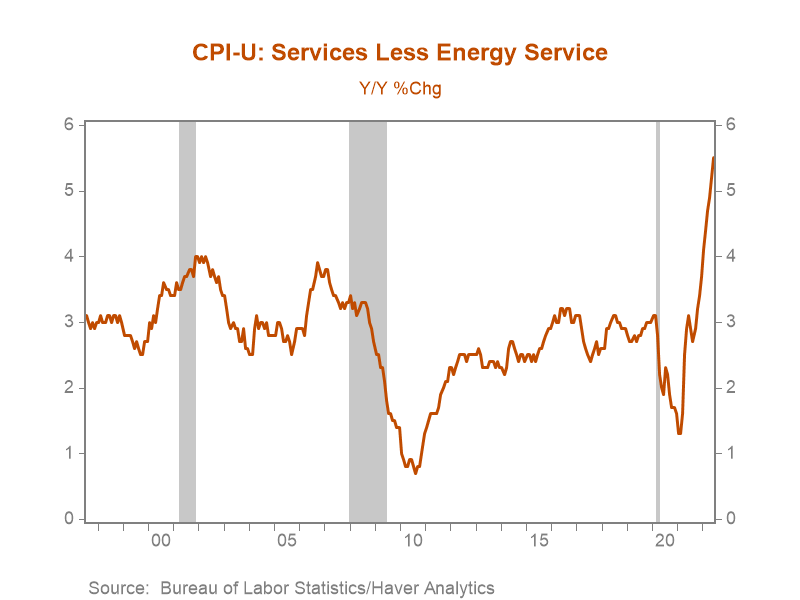
*Services inflation, the continued broadening in inflationary pressures, and sticky shelter inflation continue to present upside risks to core inflation. While demand for goods is cooling, spending on services, driven in part by the economic reopening, remains robust, and contributed to an acceleration in core services (excluding energy) prices to 0.7% m/m and 5.5% yr/yr (Chart 4). Easing nominal wage growth may cool inflationary pressures in the labor intensive services sector, but how quickly and to what extent are unclear.
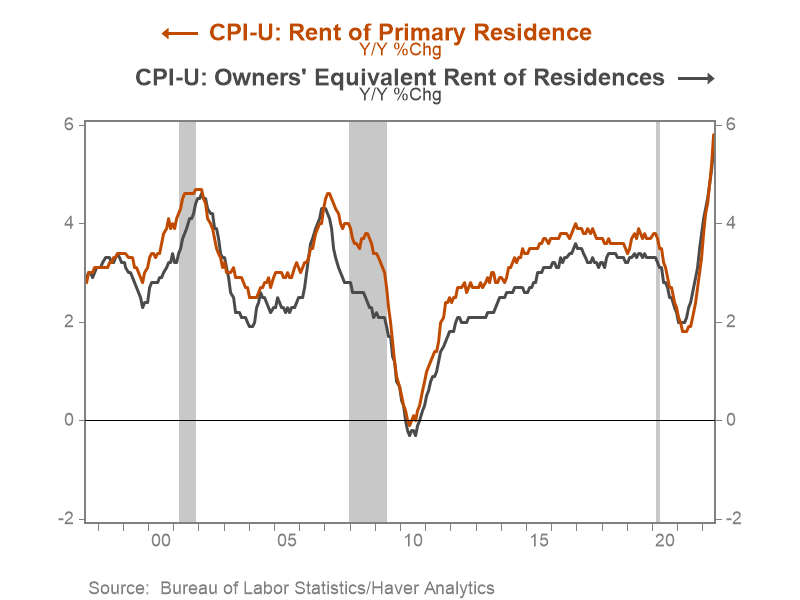
*Rent and ownersâ equivalent rent, which together account for close to one third of the CPI accelerated, rising 0.8% and 0.7%, respectively. These measures of inflation tend to lag increases in market rents and home prices by 14-16 months, so that even as the pace of home price appreciation cools, shelter inflation will likely remain elevated through mid-2023. Moreover, while home price appreciation is likely to cool, market rents have continued to rise substantially through 2022 and will exert upward pressure on shelter inflation into 2023 (Chart 5).
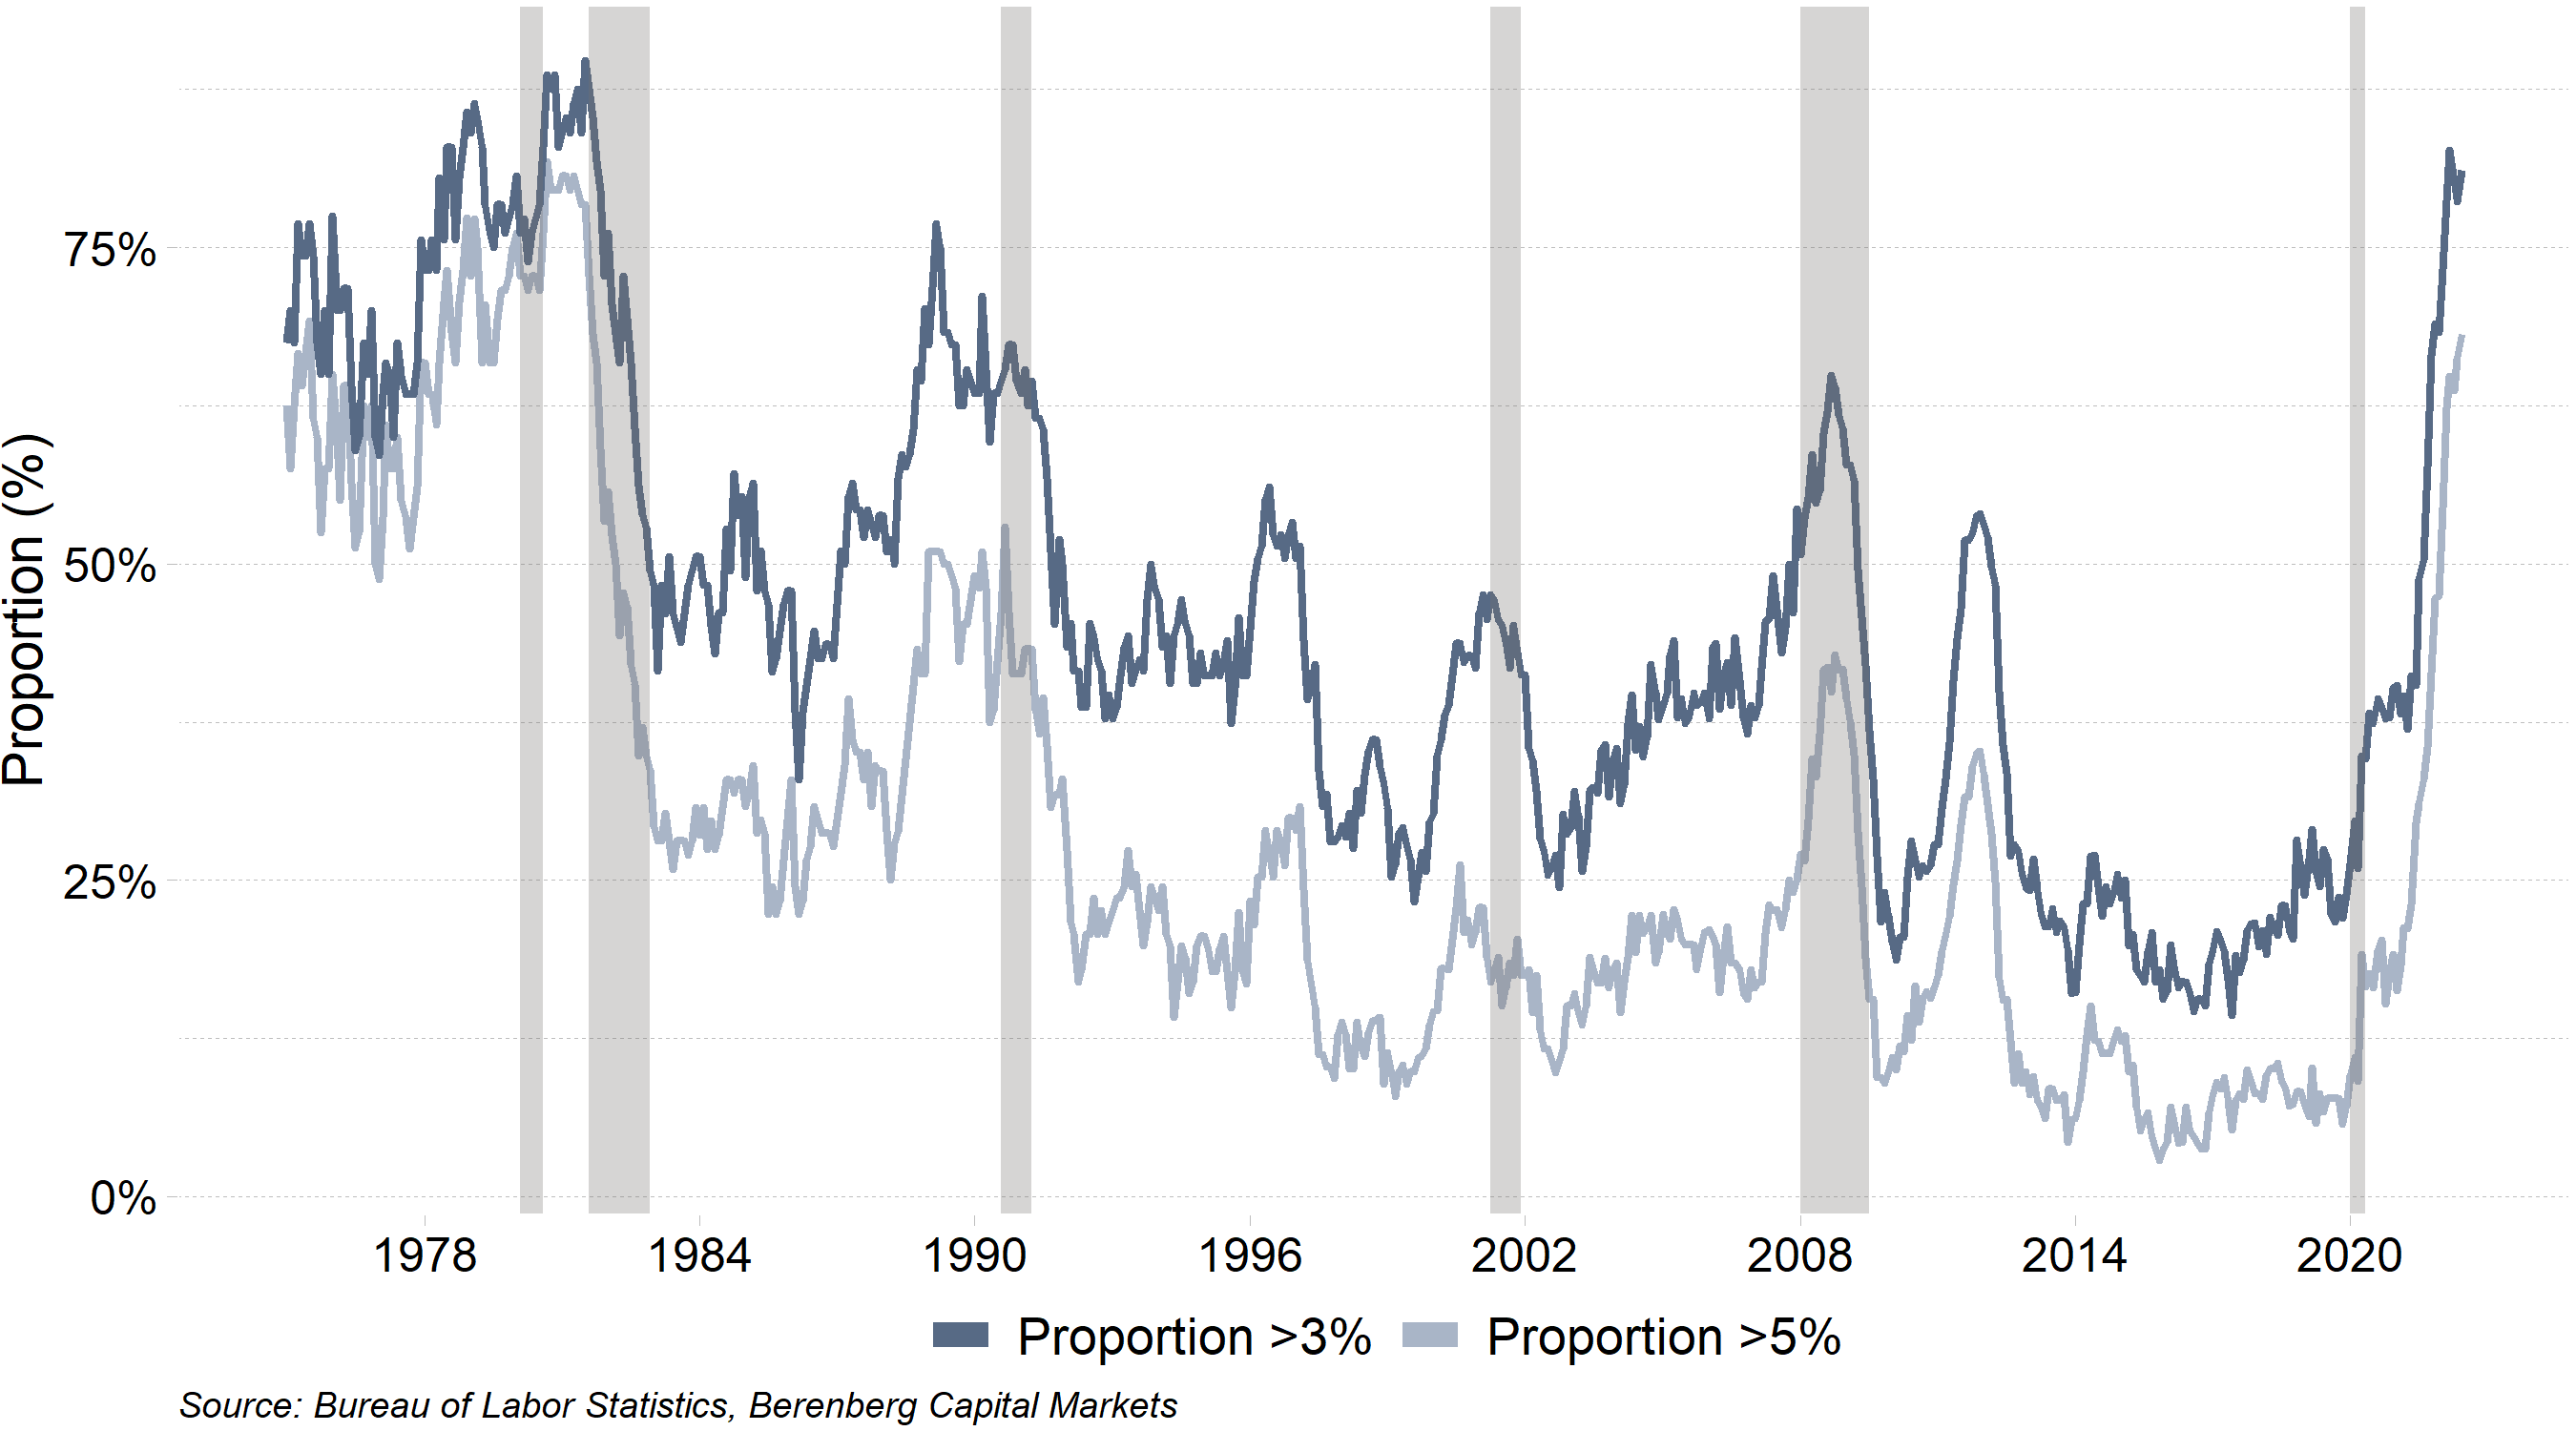
*A factor that will concern the Fed ahead of their July meeting will be the re-broadening of inflation across expenditure categories. A detailed analysis of yr/yr inflation across expenditure categories in the CPI shows that the percentage of CPI components that rose more than 3% on a yr/yr basis in June increased to 81%, while the proportion of components that rose more than 5% increased to 68% - levels comparable to the early 1980âs (Chart 6). The breadth of realized inflation, together with the rise in gasoline prices, have contributed to sharp increases in household survey-based measures of inflation expectations. Moreover, uncertainty and dispersion associated with household inflation expectations have increased, a sign that inflation expectations are beginning to de-anchor. This skews the risks that inflation psychology becomes entrenched, and will likely prompt more forceful action from the Fed.
Chart 1. Headline CPI Inflation (%, yr/yr)

Chart 2. Distribution of yr/yr Inflation Across Expenditure Categories

Chart 3. CPI â Energy

Chart 4. CPI - Core Services (ex. Energy)

Chart 5. CPI â Rent of Primary Residence and OER

Chart 6. Percentage of CPI Components Experiencing yr/yr Inflation Above 3% and 5%

Mickey Levy, mickey.levy@berenberg-us.com
Mahmoud Abu Ghzalah, mahmoud.abughzalah@berenberg-us.com
© 2022 Berenberg Capital Markets, LLC, Member FINRA and SPIC
Remarks regarding foreign investors. The preparation of this document is subject to regulation by US law. The distribution of this document in other jurisdictions may be restricted by law, and persons, into whose possession this document comes, should inform themselves about, and observe, any such restrictions. United Kingdom This document is meant exclusively for institutional investors and market professionals, but not for private customers. It is not for distribution to or the use of private investors or private customers. Copyright BCM is a wholly owned subsidiary of Joh. Berenberg, Gossler & Co. KG (âBerenberg Bankâ). BCM reserves all the rights in this document. No part of the document or its content may be rewritten, copied, photocopied or duplicated in any form by any means or redistributed without the BCMâs prior written consent. Berenberg Bank may distribute this commentary on a third party basis to its customers.