
U.S. GDP growth moderates in Q3, but outlook favorable
* Real GDP rose 2.0% q/q annualized in Q3 following robust growth of 6.7% in Q2 during the economy’s initial reopening spurt as the surge in COVID-19 cases associated with the spread of the delta variant and worsening supply chain disruptions constrained consumption and production (Chart 1). Domestic demand remained healthy, with final sales to domestic purchasers rising 1% annualized, despite the 0.1% decline in final sales of domestic product. Inventory liquidation continued but at a slower pace than in Q2, while fixed investment softened, and consumption of durable goods declined 7.3% from its record high in Q2. The GDP deflator ticked down to 5.7% annualized in Q3, reflecting continuing inflationary pressures, and is likely to remain elevated into 2022 as supply shortages persist, the impact of the delta variant wanes, and demand remains strong.
* The pace of real personal consumption expenditure growth decelerated to 0.4%, driven by the 26.2% annualized decline in durable goods consumption (Chart 2). Limited supply and the ongoing semiconductor shortage contributed to a decline in real consumption of motor vehicles and parts by 17.6% q/q, while consumption of furnishings and household equipment (-2.7%) and recreational goods and vehicles (-1.87%) also declined. Despite the fall in Q3, real durable goods consumption remains 23.5% above its pre-pandemic levels. Services consumption rose 7.9% annualized, a deceleration from Q2’s 11.5% as the delta variant’s spread stoked public health concerns and weighed on in-person service sector activity.
* Business fixed investment ticked up 1.8% annualized, a sharp deceleration from Q2’s 9.2%, reflecting declining investment in structures and equipment (Chart 3). Investment in industrial equipment rose 11.3% annualized and is 16.5% above its pre-pandemic level as businesses seek to expand production to meet strong demand. Investment in software (+3.7% q/q), and research and development (+2.3% q/q) continues to rise. Residential fixed investment growth moderated, reflecting shortages of materials and labor that have weighed on construction.
* Strong product demand amid constrained supply led to substantial inventory liquidation in 2020 that has continued into 2021 (Chart 4), while the change in private inventories remains negative on an annualized basis in Q3; it is up $106 billion relative to Q2 and contributed +2.07 percentage points to GDP growth in Q3. The uptick in inventories may reflect supply chain disruptions that have prevented businesses from delivering goods, and production constraints that have led to accumulation of raw materials and intermediate inputs. As supply disruptions dissipate, businesses will seek to replenish inventories, which would contribute positively to production and measures of GDP growth.
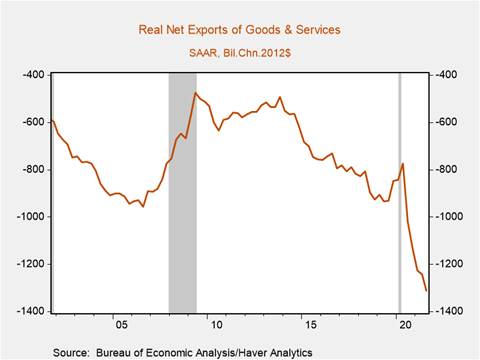
* The trade deficit widened as exports fell 2.5% q/q annualized and imports rose 6%, reducing domestic production relative to domestic demand and contributing to a -1.1 percentage point decline in Q3 GDP growth (Chart 5). The surge in imports, which have risen 33% from their intra-pandemic trough, has contributed to logjams at ports and other supply chain disruptions.
* Although growth has slowed in Q3, the critical question is what happens next. High frequency data suggest the impacts of the delta variant on economic activity are waning, and the holiday retail season looks to be strong with significant pent-up demand and healthy gains in disposable income. The recovery in the labor markets is characteristic of mature-stage economic expansions as we have argued in (Labor market stresses amid “substantial progress” toward the Fed’s employment mandate), and rising wages and employment will support growth in consumption moving forward. Private inventory investment will likely rise as businesses replenish severely depleted inventories, as will private residential investment as material and labor shortages resolve.
Chart 1: Real GDP and Real Final Sales to Domestic Purchasers
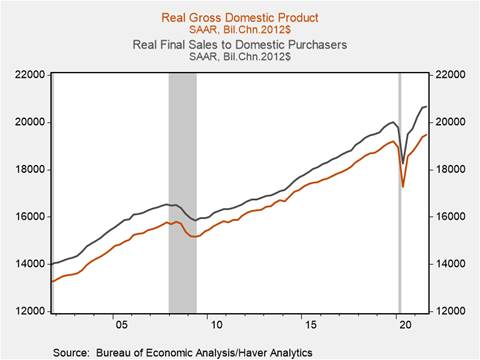
Chart 2: Real Personal Consumption Expenditures: Durable Goods vs. Services
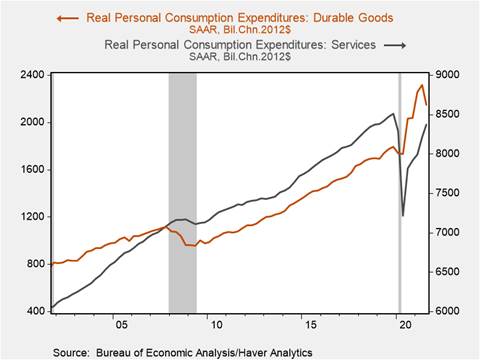
Chart 3: Real Business Fixed Investment
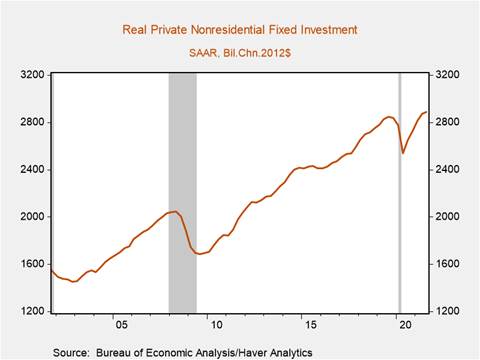
Chart 4: Change in Private Inventories
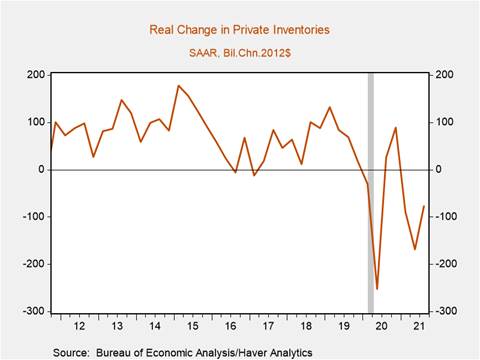
Chart 5: Real Net Exports
Mickey Levy, mickey.levy@berenberg-us.com
Mahmoud Abu Ghzalah, mahmoud.abughzalah@berenberg-us.com
© 2021 Berenberg Capital Markets, LLC, Member FINRA and SPIC
Remarks regarding foreign investors. The preparation of this document is subject to regulation by US law. The distribution of this document in other jurisdictions may be restricted by law, and persons, into whose possession this document comes, should inform themselves about, and observe, any such restrictions. United Kingdom This document is meant exclusively for institutional investors and market professionals, but not for private customers. It is not for distribution to or the use of private investors or private customers. Copyright BCM is a wholly owned subsidiary of Joh. Berenberg, Gossler & Co. KG (“Berenberg Bank”). BCM reserves all the rights in this document. No part of the document or its content may be rewritten, copied, photocopied or duplicated in any form by any means or redistributed without the BCM’s prior written consent. Berenberg Bank may distribute this commentary on a third party basis to its customers.