|
 |
Many investors have wondered why the stock market has performed so well and the much-anticipated recession seems not to be anywhere on the horizon. Bloomberg’s Simon White has provided some good insights that may answer those questions in his article posted at Zero Hedge, titled, “Did You Spot the Gorilla in the Fed’s Meeting Room?” He notes that rising interest rates are effectively an illusion. https://www.zerohedge.com/markets/did-you-spot-gorilla-feds-meeting-room
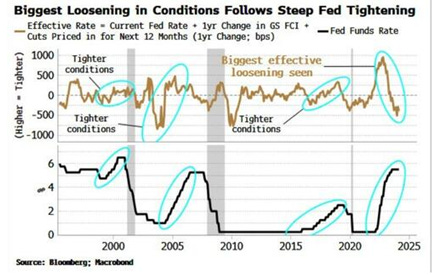
The chart above showsthe Effective Fed Rate: It is the policy rate, plus its expected change over the next year, plus the one-year change in Goldman Sachs’ Financial Conditions Index, which is calibrated to convert the move in stocks, equity volatility, credit spreads, and so on, to an equivalent change in the Fed’s rate. As can be seen, in the three prior rate-hiking cycles the Effective Rate tightened; this time the rate has loosened, by more than it has done in at least 30 years.
With effective rates declining rather than rising, that at least in part explains why financial and labor markets have been so strong. But why, if that’s the case, have inflation rates come down? Simon White points to data collected by the San Francisco Fed, which separates cyclical inflationary items with non-cyclical items in the inflation data. Cyclical data, which is impacted by the Fed, has not declined at all. But non-cyclical data has fallen and is responsible for virtually all of the decline in the CPI. In fact, cyclical inflation remains at a 40-year high. Moreover, based on the last couple of monthly data, it seems that the entire CPI may be starting to ascend again.
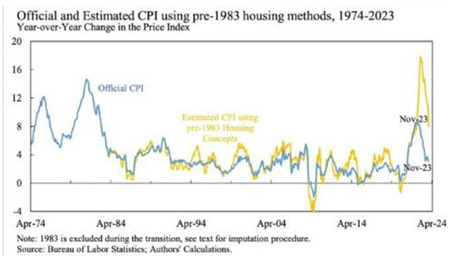
Actually, inflation is even worse if we account forborrowing costs as indicated by the yellow line in the chart on your right. Mortgage costs were taken out of CPI in 1983 and car repayments in 1998. In a recent NBER paper by Larry Summers et al, the authors reconstructed CPI to take account of housing borrowing costs. Inflation on this measure not only peaked much higher than it did in the 1970s, it is still running at 8%!
The source of the data and chart above the NBER Working Paper 32163. The main point of the paper is that the reason consumer sentiment indices have been depressed despite falling inflation is that they do include the impact of higher borrowing costs. In other words, President Biden’s bravado about his brilliance in creating the best economy ever doesn’t ring true to common folks.
White also points out that the labor markets have remained strong, as have corporate profit margins, largely because the Biden Administration is running enormously large budget deficits. White suggests that the very slow recovery in China and the resulting very low demand for commodities and other items sold on the global markets has helped reduce inflation from non-cyclical items. And with oil prices starting to tick up again, there is every reason to believe the Fed has not won its war against inflation.
So why is Powell still leaving open the notion of three more rate cuts this year? White thinks if he does, it will be regretted down the road as inflation comes back perhaps stronger than ever. The short answer is that the U.S. financial system in nearing the point in time when all will come to understand it is nearing factual if not nominal insolvency.
Not to be confused with Simon White, a tweeter named “Simon Says” suggested there is no problem when he wrote on Twitter that “Yellen currently has $844 billion in the TGA and has drained the RRP by more than $1 trillion since the government’s current fiscal year began on October 1. If she targets the remaining RRP she will be able to pretty much fund the deficit until the election.”
To which another tweeter named MikeCristo8 replied via: “You are ALL forgetting, Yellen must roll over $2 trillion in T-Notes which are expiring this month. Plus, she needs to roll over another $10 trillion ($2 trillion in March alone) of 7-year bonds (issued in 2017) by June, at a rate of 6%.
“Now watch OPEC pull the plug on the USD. Foreigners will liquidate their holdings. It’s NOT what she has in the TGA. It’s what she must pay out. We are already in a bond default that is already happening via the ESF, which is now bailing out the Treasury. And inflation will eat at her tax receipts. Powell didn’t raise rates because the Treasury is in a debt trap. Over the next two weeks, things could get ugly.”
In a separate Tweet, MikeCristo8 also pointed out that rule changes in Basal III is hurting the ability of primary dealers to buy government bonds. Under those stricter rules, According to MikeCristo8, the primary dealers do not have enough collateral to buy more U.S. Treasuries. Then MikeCristo added, “Now you know why China has been hoarding gold.”
For those who may not be aware, under Basel III, actual physical gold held by banks is considered ZERO RISK along with the debt of sovereign nations with AAA treasury ratings. AAA to AA- ratings for corporate debt carries 10% and 20% risk ratings, whereas junk bonds can carry 100% to 150% risk weightings! Banks have to increase their equity to compensate for higher risk levels, which will reduce return on invested capital.
Moreover, you can imagine how a deep recession that takes ratings down would increase equity dilution and very unhappy shareholders. We must not forget that in the U.S. there are a large number of zombie companies that are going to have to refinance their debts in the coming years at much, much higher rates. Zombie companies that have been on low interest rate life support may not survive. Banks won’t want to hold loans to those kinds of companies. But allocated gold with its zero risk makes total sense when you understand that gold is in fact money and everything else including sovereign debt is credit. Having gold with zero risk then is preferable.
Own Physical Gold, not Fake Gold
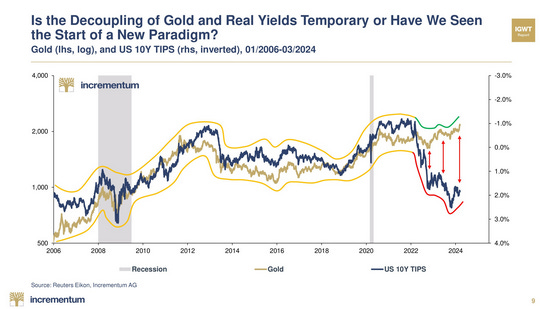
On the other hand, unallocated or paper gold (for example, futures contracts) which banks have in the past typically owned, isn’t being considered zero risk under Basal III even though in the minds of indoctrinated Keynesian economists in the West, paper gold is as good as gold bullion. As noted above by MikeCristo8, China has been building its gold reserves massively and that may explain for the very noticeable decoupling of gold (gold line) with real treasury yields (black line) in the chart above.
Once upon a time the dollar was as good as gold. No More! The Chinese and other BRIC nations know it even if Keynesian economists at the Fed do not. As the world recognizes that the U.S. dollar is in deep do do, they are no longer buying Treasuries. Instead they are buying gold. Globally if not in the U.S. gold seems to be winning the “safe haven” contest over U.S. Treasuries as indicated by the chart above.
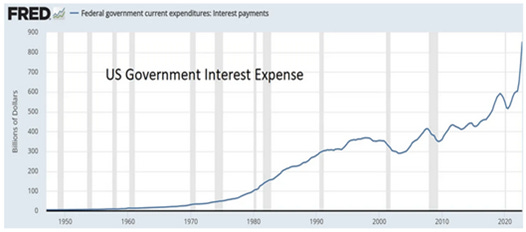
On reason why governments outside of the NATO group may be selling treasuries and buying gold should be obvious from the following chart. It shows what a debt trap looks like.
With major foreign lenders to the U.S. exiting the dollar in favor of gold and other assets around the world, the U.S. is now adding to its debt burden $1 trillion every 100 days! When rates were zero it was easy for the U.S. Congress to borrow money that was virtually fee. But now that the markets are demanding more normal rates of interest, you can see the exponential trajectory of interest expense for the U.S. The U.S. is spending money like drunken sailors with no apparent concern. But the math simply doesn’t work. To fund the U.S. debt at higher rates the Fed is going to have to print money like drunken sailors to make sure the drunks in Washington have enough liquidity simply to pay the interest on the debt.
Meantime time the Biden Administration and whoever wins the 2024 election can be counted on to keep increasing the deficit to keep their vote buying illusion alive until it mathematically breaks down at which time dollar will be toast.
I have always said that gold isn’t increasing in value. That too is an illusion. However when measured against fiat currencies, it is holding steady so that investors who own gold as their nest egg are finding they are gaining against other investors who put their faith in imaginary money like the U.S. dollar or any other fiat currency.
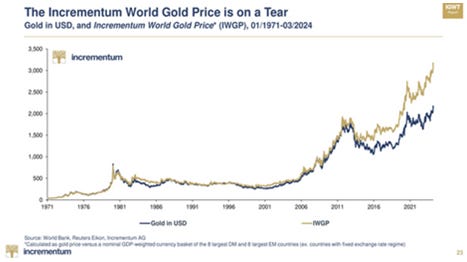
Yes the dollar has been a “strong” via-a-vis other fiat currencies so the price of gold has been rising faster in non dollar fiat currencies. But as this chart shows, even the “almighty dollar” backed by the “almighty U.S. military” is losing ground to gold as the yellow metal has surged to new highs, hitting a high $2,222 a few days ago.
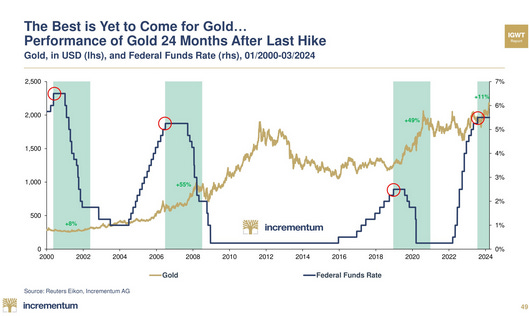
Although gold has hit a new high, there is reason to think this is just the beginning of this last leg up in this secular bull market for gold. As the following chart shows, during the last three gold bull markets, the real rise has not occurred until after the last rate hike. With Jerome Powell suggesting three rate hikes before the end of this year, it seems the time for the next major move in gold is now or very close to its time.
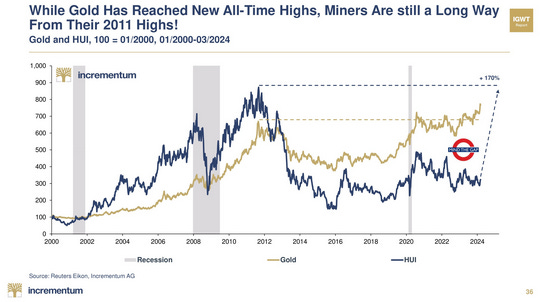
So far gold shares have not performed very well. Perhaps the last rate hike is what investors waiting for to get into the mining shares. relative to gold as the following chart shows:
Although the market has not yet shown much interest in the mining sector, J Taylor’s Gold, Energy & Tech Stocks have been following the development of several emerging world class gold, silver and copper deposits in addition to a very interesting silver-tin project and another world class silver-copper sedimentary exploration project.
You may want to sign up for my letter now before the next move or at least keep it in your sights so you will be ready to enter into this counter cyclical equity sector because when the mining shares catch fire they become one of hottest equity sectors. Please keep that in mind!
Best wishers,
Jay Taylor
You're currently a free subscriber to J Taylor's Gold Energy & Tech Stocks. For the full experience, upgrade your subscription.
